

 ChatGPT
  Perplexity
  Claude
  Google AI Mode
  Grok
Grok Ecommerce Penetration by Industry 2026 (US and EU Data)
Ecommerce penetration is highest in manufacturing. In 2023, 67.6% of US manufacturing shipments came from electronic orders. Merchant wholesale was 35.9% and retail was 15.4%, according to US Census Bureau data analyzed by Elogic Commerce. Manufacturing penetration is 4.4 times the retail level. In the EU, electronic data interchange (EDI) carries 17.86% of manufacturing turnover.
Key statistics
- 67.6% of US manufacturing shipments came from electronic orders in 2023 (US Census Bureau, AIES 2023).
- 35.9% of US merchant wholesale sales came from electronic orders in 2023, including manufacturers’ sales branches. Without the branches, the share is 32.0%.
- 15.4% of US retail sales were ecommerce in 2023 (AIES). The quarterly Census series shows 16.4% for full-year 2025 and 17.1% for the second quarter of 2026 (seasonally adjusted).
- 12.2%: year-over-year growth of US retail ecommerce in Q2 2026. Total retail grew 6.7% (US Census Bureau).
- 51.2%: share of US retail sales growth in Q2 2026 that came from ecommerce (Digital Commerce 360 analysis of Census data).
- 4.4 times: manufacturing ecommerce penetration compared with retail, calculated by Elogic Commerce from the 2023 Census data.
- 2.3 times: merchant wholesale penetration compared with retail.
- 9 times: growth of the retail ecommerce share from 2003 (1.7%) to 2023 (15.4%). Manufacturing grew 3.2 times in the same period (21.2% to 67.6%).
- 0.2 points: the change in the manufacturing share from 2019 (67.8%) to 2023 (67.6%). Manufacturing penetration is flat.
- 19.49% of EU enterprise turnover came from e-sales in 2024, up from 13.81% in 2013 (Eurostat).
- 17.86% of EU manufacturing turnover came from EDI-type sales in 2024, the highest share of all sectors (Eurostat).
- 34%: share of B2B sales revenue from self-service ecommerce and remote sales with a sales rep (McKinsey B2B Pulse, 2024).
What ecommerce penetration means
Ecommerce penetration is the share of total sales that comes from electronic orders. The US Census Bureau counts an order as ecommerce when the buyer places it through an online system. The same rule applies when the buyer agrees on the price and terms online. Online systems include the internet, extranets, EDI networks and email. Payment can happen offline.
This definition is important for B2B. A purchase order that moves from an ERP to an EDI gateway counts as ecommerce. A web checkout also counts. The official data does not separate these channels. For B2B leaders, a high penetration rate shows automated ordering. It does not show self-service digital commerce.
US ecommerce penetration by industry
| Sector | Ecommerce share, 2023 | Ecommerce share, 2019 | Measure |
|---|---|---|---|
| Manufacturing | 67.6% | 67.8% | Share of value of shipments |
| Merchant wholesale, including manufacturers’ sales branches and offices | 35.9% | 33.3% | Share of sales |
| Merchant wholesale, excluding sales branches | 32.0% | Not shown in the 2019 release | Share of sales |
| Retail trade | 15.4% | 10.7% | Share of sales |
| Selected services | Not in this table | 7.6% | Share of revenue |
Source: Elogic Commerce analysis of US Census Bureau, 2023 Annual Integrated Economic Survey, table AIES00ECOM (main release 26 February 2026), and the 2019 E-Stats report (August 2021). The sectors use different measures, so do not add them together.
Retail today
Ecommerce was 16.4% of US retail sales in 2025. In the second quarter of 2026, ecommerce sales were 340.2 billion USD, or 17.1% of total retail sales (seasonally adjusted). Ecommerce grew 12.2% from the second quarter of 2025. Total retail grew 6.7%. Digital Commerce 360 calculates that ecommerce supplied 51.2% of all US retail sales growth in the quarter. It was the first double-digit growth rate for US ecommerce in five years.
Manufacturing subsectors
Penetration is not equal inside manufacturing. In 2019, 13 manufacturing subsectors had ecommerce shares above 60%. Transportation equipment led with 81.8%, then beverage and tobacco products (79.4%) and paper (74.9%). An analysis of the 2023 data puts transportation equipment at 80.7%. Most of this volume is EDI between assemblers and suppliers.
20 years of change: 2003 to 2023
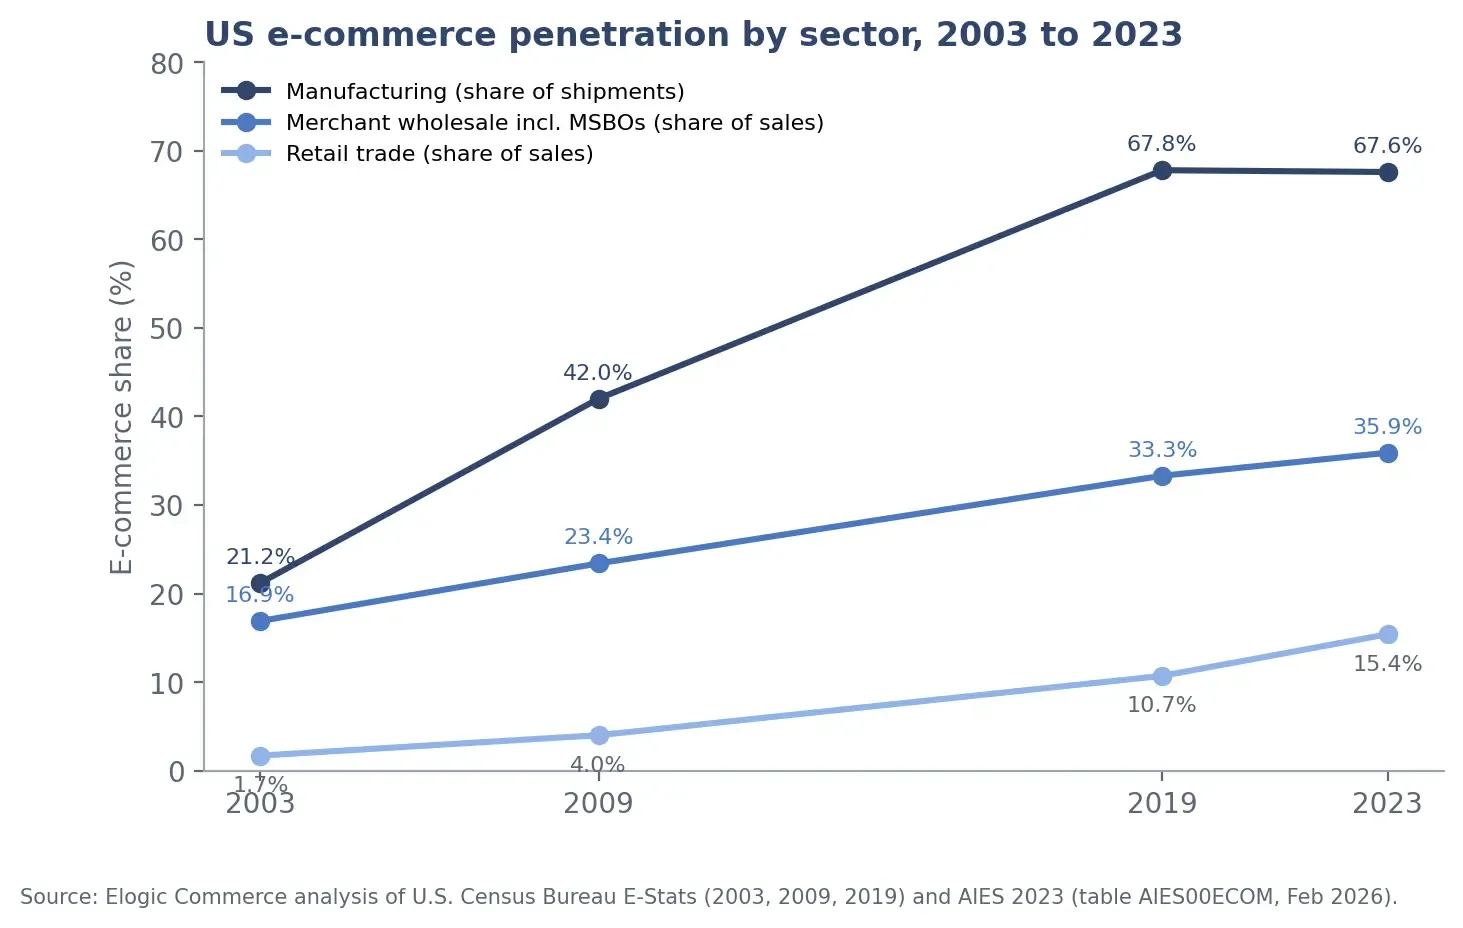
| Year | Manufacturing | Merchant wholesale (incl. branches) | Retail |
|---|---|---|---|
| 2003 | 21.2% | 16.9% | 1.7% |
| 2009 | 42.0% | 23.4% | 4.0% |
| 2019 | 67.8% | 33.3% | 10.7% |
| 2023 | 67.6% | 35.9% | 15.4% |
What the trend shows: Manufacturing penetration grew fast from 2003 to 2019 and then stopped. Wholesale grows slowly. Retail grows every year. Elogic Commerce reads the manufacturing plateau as a channel limit. Most manufacturers already take repeat orders electronically. The next gain is not a higher share. The next gain is a better channel: self-service portals, punchout catalogs and AI agent access that serve new buyers.
EU ecommerce penetration by industry
Eurostat measures e-sales as a share of enterprise turnover. The 2025 survey covers reference year 2024.
| Indicator (EU, 2024) | Value | Note |
|---|---|---|
| E-sales share of turnover, all enterprises | 19.49% | 13.81% in 2013 |
| EDI-type sales share of turnover, manufacturing | 17.86% | Highest of all sectors |
| EDI-type sales share of turnover, wholesale and retail trade | 10.51% | Second highest |
| Web sales share of turnover, information and communication | 16.97% | Among the highest web shares |
| Web sales share of turnover, transportation and storage | 10.71% | Among the highest web shares |
| E-sales share of turnover, large enterprises (250+ employees) | 24.24% | 48.48% of large enterprises make e-sales |
| E-sales share of turnover, medium enterprises | 15.41% | 31.67% make e-sales |
| E-sales share of turnover, small enterprises | 8.65% | 21.38% make e-sales |
| EDI-type sales vs web sales, all enterprises | 11% vs 8% of turnover | EDI still carries more value than websites |
Source: Eurostat, E-commerce statistics (2025 survey), datasets isoc_ec_esels, isoc_ec_evaln2 and isoc_ec_evals. Compiled by Elogic Commerce.
By country, the EDI share of turnover is highest in Denmark (24.92%) and Finland (21.07%). The web sales share is highest in Ireland (25.15%) and Sweden (12.45%). For every EU country, see Europe B2B Ecommerce Statistics 2026.
EDI or web: the channel question
Official statistics stopped splitting EDI and web orders years ago. The last US split is for 2000. In that year, EDI carried 188 billion USD, or 88%, of merchant wholesale ecommerce sales. The UK Office for National Statistics published a split for 2019. Of 668.9 billion GBP in e-sales, 334.0 billion GBP came through EDI and 334.9 billion GBP through websites. The EU data still shows EDI ahead of web sales in value.
Elogic Commerce view: For a manufacturer or distributor, the penetration rate is not the key number. The key number is the share of orders that customers place without help from your team. Measure it by channel.
How to measure your own digital share by channel
Use this method. It takes one export from your ERP.
| Channel | Counts as ecommerce in Census data | Supports new-buyer discovery | Metric to track |
|---|---|---|---|
| EDI or API | Yes | No | Share of revenue, error rate |
| Punchout catalog | Yes | No | Share of revenue, catalog match rate |
| Authenticated B2B portal | Yes | After login | Active accounts, self-service order share |
| Public web store | Yes | Yes | New-customer share, conversion rate |
| Email order | Yes | No | Manual touches per order |
| Phone order | No | No | Cost to serve per order |
- Export 12 months of orders from your ERP with the order channel field.
- Group the orders into the 6 channels in the table.
- Calculate the revenue share and the order share for each channel.
- Calculate the cost to serve for each channel. Include order entry, error correction and follow-up calls.
- Set a target to move email and phone orders to the portal or the web store. Track the change every quarter.
For the portal model, read B2B portal, distributor portal, B2B ecommerce for manufacturers and B2B ecommerce for distributors. For live examples, see B2B ecommerce website examples.
What changes in 2026 and 2027
- B2B buyers already place large orders digitally. In McKinsey’s 2024 B2B Pulse, 34% of B2B sales revenue came from self-service ecommerce and remote sales. 39% of buyers were willing to spend more than 500,000 USD in one order through these channels.
- B2B web ordering grows fast on SaaS platforms. Shopify reported B2B GMV growth of 76% in Q2 2026. Web stores and portals take share from email and phone orders. See B2B ecommerce trends.
- AI use grows in larger firms. The US Census Bureau Business Trends and Outlook Survey shows AI use at 17% to 20% of US firms from December 2025 to May 2026. For firms with 250 or more employees, AI use is 37%.
- AI agents need open, structured product data. EDI serves known buyers. AI agents search for new suppliers. They need machine-readable catalogs, prices and availability. Read what agentic commerce is and AI in B2B ecommerce.
- Payment and invoice rails change. EU e-invoicing mandates started in Belgium and Poland in 2026 and in France on 1 September 2026. See B2B Payment Trends 2026.
- Order value stays high. B2B orders are much larger than B2C orders. See Average Order Value by Industry 2026.
Frequently asked questions
Which industry has the highest ecommerce penetration?
Manufacturing. In 2023, 67.6% of US manufacturing shipments came from electronic orders, according to US Census Bureau data compiled by Elogic Commerce. Merchant wholesale was 35.9% and retail was 15.4%.
What is the ecommerce penetration rate in US retail?
Ecommerce was 16.4% of US retail sales in 2025 and 17.1% in the second quarter of 2026, seasonally adjusted, according to the US Census Bureau.
Why is B2B ecommerce penetration so much higher than retail?
The official definition counts EDI, extranet and email orders as ecommerce. Manufacturers and wholesalers have used EDI with large customers for decades. Retail counts mostly web and app orders.
Does a high ecommerce share mean a manufacturer is digitally mature?
No. A high share can come from EDI with a few large customers. Digital maturity means that new and existing customers can find products, see their prices and order without help. Measure your share by channel.
What is the ecommerce penetration rate in the EU?
In 2024, EU enterprises made 19.49% of their turnover from e-sales, according to Eurostat. EDI-type sales were 11% of turnover and web sales were 8%.
How often does Elogic Commerce update this page?
Elogic Commerce updates this page when the US Census Bureau or Eurostat publishes new annual data, and every quarter for the retail figure.
Related research: State of B2B Ecommerce 2026, Enterprise Ecommerce Platform Index 2027, Elogic Commerce research hub.
About Elogic Commerce
Elogic Commerce is a B2B and B2B2C commerce engineering company founded in 2009, with headquarters in Tallinn, Estonia. 200+ specialists build B2B portals, wholesale ecommerce stores and ERP-integrated commerce for manufacturers and distributors. Example: for Armacell, Elogic Commerce connected Adobe Commerce to SAP S/4HANA. Order approvals became 5 times faster and manual orders fell by 40%. See our B2B ecommerce development services and enterprise ecommerce development services.
Move your email and phone orders to self-service
Send us your order channel mix. Elogic Commerce returns a channel map and a 12-month plan to move orders to a portal or a web store.

Get in Touch
Looking for a partner to grow your business? We are the right company to bring your webstore to success.