


 ChatGPT
  Perplexity
  Claude
  Google AI Mode
  Grok
Grok B2B Ecommerce Trends & Statistics 2026
Summary
Key takeaways
- AI is moving from influencing B2B purchases to actively participating in quoting, approving, reordering, and negotiating within defined commercial rules.
- Agentic commerce in B2B depends on APIs that expose accurate contract pricing, approved catalogs, inventory, and purchasing terms.
- Self-service has become the default buying mode: buyers increasingly expect to check account pricing, reorder products, request quotes, and place high-value orders without contacting a sales representative.
- Product discovery is shifting away from supplier websites toward generative AI tools and AI-powered search experiences.
- Machine-readable product information—including structured specifications, GTINs, MPNs, and factual descriptions—is becoming essential for visibility in AI-generated answers.
- Composable MACH architecture can provide the flexibility and API access needed for agentic commerce, but it is valuable only when the added operational complexity is properly governed.
- Data and integration readiness is the central constraint behind every major B2B ecommerce trend. AI amplifies inaccurate product data, disconnected systems, and inconsistent pricing rather than fixing them.
- B2B buyers increasingly expect B2C-grade convenience, including intuitive interfaces, embedded finance, omnichannel continuity, and fast checkout, while still requiring account pricing, bulk ordering, approvals, and payment terms.
- Governance is a prerequisite for safe automation. Permissions, transaction limits, audit trails, authorization rules, and human override mechanisms determine which actions agents can perform.
- Competitive advantage in 2026 comes less from adding storefront features and more from maintaining clean data, connected systems, accessible APIs, and enforceable commercial policies.
When this applies
This applies when a manufacturer, distributor, wholesaler, or other B2B seller is planning its commerce roadmap and needs to prepare for AI-assisted buying, digital self-service, and increasingly automated procurement. It is particularly relevant to businesses with account-specific pricing, negotiated contracts, quote workflows, repeat ordering, ERP-controlled inventory, or complex product catalogs. The framework is also useful when deciding whether to modernize integrations, adopt composable architecture, improve product data, or introduce governance for AI-enabled workflows.
When this does not apply
This does not apply when the business only needs minor storefront improvements or operates a simple ecommerce model without negotiated pricing, company accounts, approvals, or backend-system dependencies. It is also not a detailed implementation guide for any single trend. A company needing a specific ERP integration plan, AI governance framework, portal specification, or composable architecture design will require a deeper technical assessment beyond this strategic overview.
Checklist
- Identify which of the seven trends directly affects your customers and revenue model.
- Separate general AI experimentation from agent-ready commerce capabilities.
- Document the commercial rules an AI agent would need to follow.
- Audit API access to pricing, catalogs, contracts, inventory, and checkout.
- Confirm that buyers can view account pricing and product availability without contacting sales.
- Add quick reorder, saved lists, and self-service quote requests where appropriate.
- Test whether high-value purchases can be completed through digital channels.
- Structure product attributes, specifications, GTINs, and MPNs for machine consumption.
- Review how your products appear in AI-generated research and comparison journeys.
- Decide whether composable architecture solves a genuine scalability or flexibility constraint.
- Map synchronization gaps across ERP, PIM, CPQ, CRM, OMS, and commerce systems.
- Improve B2C-style convenience without removing essential B2B account controls.
- Evaluate embedded finance, trade credit, and omnichannel continuity where relevant.
- Define permissions, transaction limits, audit logs, approvals, and human overrides for automation.
- Fix foundational data and integration problems before expanding AI functionality.
Common pitfalls
- Treating B2B agentic commerce as ordinary consumer AI shopping.
- Allowing agents to act without respecting contracts, supplier rules, and negotiated pricing.
- Launching a self-service portal that still requires phone calls for pricing, quotes, or reorders.
- Expecting AI engines to understand incomplete or inconsistent product information.
- Choosing composable architecture because it is fashionable rather than operationally justified.
- Adding more APIs and services without clear ownership and governance.
- Copying B2C experiences while ignoring approvals, account hierarchies, credit terms, and bulk purchasing.
- Buying AI tools before stabilizing ERP, PIM, CPQ, and pricing synchronization.
- Attempting to implement every trend simultaneously instead of prioritizing high-value use cases.
- Investing in visible frontend features while the underlying data and integration foundation remains unreliable.
ELOGIC COMMERCE B2B COMMERCE BENCHMARK INDEX 2026
An evidence-graded view of how B2B buyers purchase, which commerce shifts matter, what implementation and ERP scope cost, and where projects create measurable operational value. Public market data is separated from forecasts, vendor research, and Elogic Commerce project benchmarks.
Quick answer: B2B ecommerce in 2026 is shifting from digital catalog access to AI-assisted, ERP-connected self-service. The highest-impact changes are agentic buying, machine-readable product data, native B2B workflows, composable architecture, and tighter governance. The companies best positioned to benefit are not those with the most AI tools, but those with accurate product data, real-time pricing, connected systems, and controlled transaction rules.
This report consolidates B2B ecommerce trend analysis, market statistics, buyer research, implementation evidence, and Elogic Commerce case results into one annual benchmark. Each number is labeled by evidence type and scope so that a measured result is not confused with a forecast, a buyer preference survey is not presented as transaction data, and one project outcome is not generalized into a market average.
B2B ecommerce trends and statistics: key findings
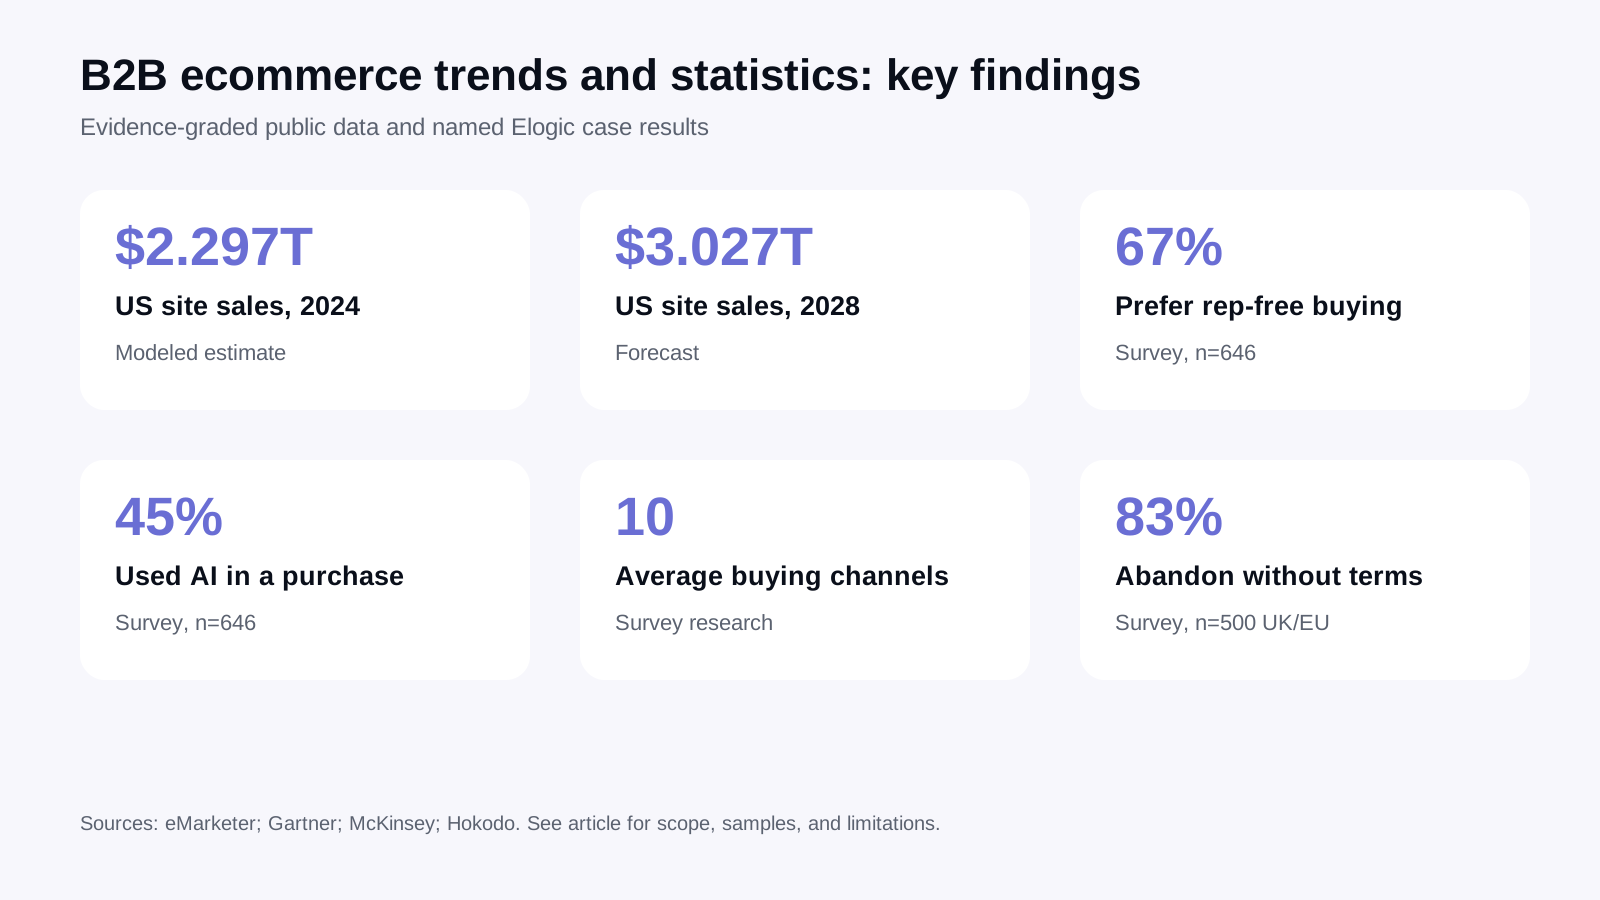
The strongest evidence points to a market that is still growing, but the more important shift is operational: buyers are moving more research, ordering, reordering, and account management into digital channels. AI is beginning to influence purchasing, yet autonomous transactions remain uncommon. The immediate advantage comes from making commercial data and workflows reliable enough for buyers, sales teams, and software agents to use safely.
| Finding | Result | Scope and sample | Evidence type | Confidence |
|---|---|---|---|---|
| US B2B ecommerce site sales | $2.297 trillion in 2024, up 10.5% year over year | US website and portal orders; excludes EDI, phone, and fax | Modeled market estimate | High, with scope caveat |
| US B2B ecommerce site sales forecast | $3.027 trillion by 2028; average 7.8% annual growth from 2024 to 2028 | US website and portal orders | Forecast | High for a forecast |
| Preference for a rep-free buying experience | 67% | 646 B2B buyers surveyed in August–September 2025 | Survey finding | Medium-high |
| Use of AI during a recent purchase | 45% | Same Gartner survey of 646 B2B buyers | Survey finding | Medium-high |
| Preferred interaction model | Approximately one-third in person, one-third remote, and one-third digital self-service | Cross-country B2B buyer research | Independent survey research | High |
| Average number of buying channels | 10 | Across the B2B buying journey | Independent survey research | High |
| Point of first seller contact | 61% of the buying journey; the winning vendor was already on the Day One shortlist in 95% of cases | Nearly 4,000 B2B buyers globally | Vendor research | Medium-high, with population caveat |
| Checkout abandonment when payment terms are unavailable | 83% | 500 B2B buyers across Europe and the UK | Vendor-sponsored survey | Medium, with geographic caveat |
The table deliberately mixes measured estimates, forecasts, surveys, and case evidence only when the source type is visible. These figures should not be averaged together or treated as equivalent forms of proof.
“AI will not fix broken B2B data; companies need reliable product, pricing, inventory, and customer information before automation can create value.
Paul Okhrem Co-Founder & CEO of Elogic Commerce, a leading ecommerce consulting and development company
What changed in B2B ecommerce in 2026?
In 2026, the center of gravity moves from “put the catalog online” to “make the buying operation executable through connected digital systems.” Buyers increasingly use AI to research requirements and compare suppliers, while commerce teams begin testing agents for quotation, reorder, and service workflows. At the same time, buyer expectations are becoming more self-directed: Gartner reports that 67% prefer a rep-free experience and 45% used AI during a recent purchase.
That does not mean human selling disappears. McKinsey’s rule of thirds remains a better operating model than a digital-only assumption: buyers divide their preferences among in-person, remote, and self-service interactions, and they move across an average of ten channels. The practical requirement is continuity. A buyer should be able to research independently, request help when the decision becomes complex, and complete the transaction without losing account context, negotiated terms, or previous work.
Agentic commerce is also more limited than the hype suggests. Forrester forecasts that 20% of B2B sellers will need to respond to AI-powered buyer agents with seller-controlled counteroffers in 2026. However, its mid-2026 assessment says that most agentic experiences remain conversational, true autonomy is rare, and B2B adoption is still early. The near-term task is therefore not to delegate unrestricted purchasing to AI. It is to prepare data, permissions, APIs, and transaction rules for controlled automation.
| Earlier digital model | 2026 operating model | What must change |
|---|---|---|
| Public catalog and inquiry form | Account-specific self-service | Expose contracts, catalogs, pricing, credit, order history, and permissions |
| Search begins on the supplier website | Research begins in search engines, AI tools, marketplaces, and procurement systems | Make product data complete, structured, current, and consistent |
| Sales reps manually bridge system gaps | ERP-connected workflows support buyers and reps from the same data | Define systems of record, synchronization rules, exception handling, and ownership |
| AI recommends content | AI begins supporting quotes, reorders, negotiation, and service tasks | Add transaction guardrails, audit trails, identity, permissions, and approval rules |
| Architecture is selected mainly by platform features | Architecture is selected by workflow, integration, ownership, and change velocity | Choose monolithic, SaaS, or composable patterns according to operating needs |
B2B ecommerce market size and digital revenue share
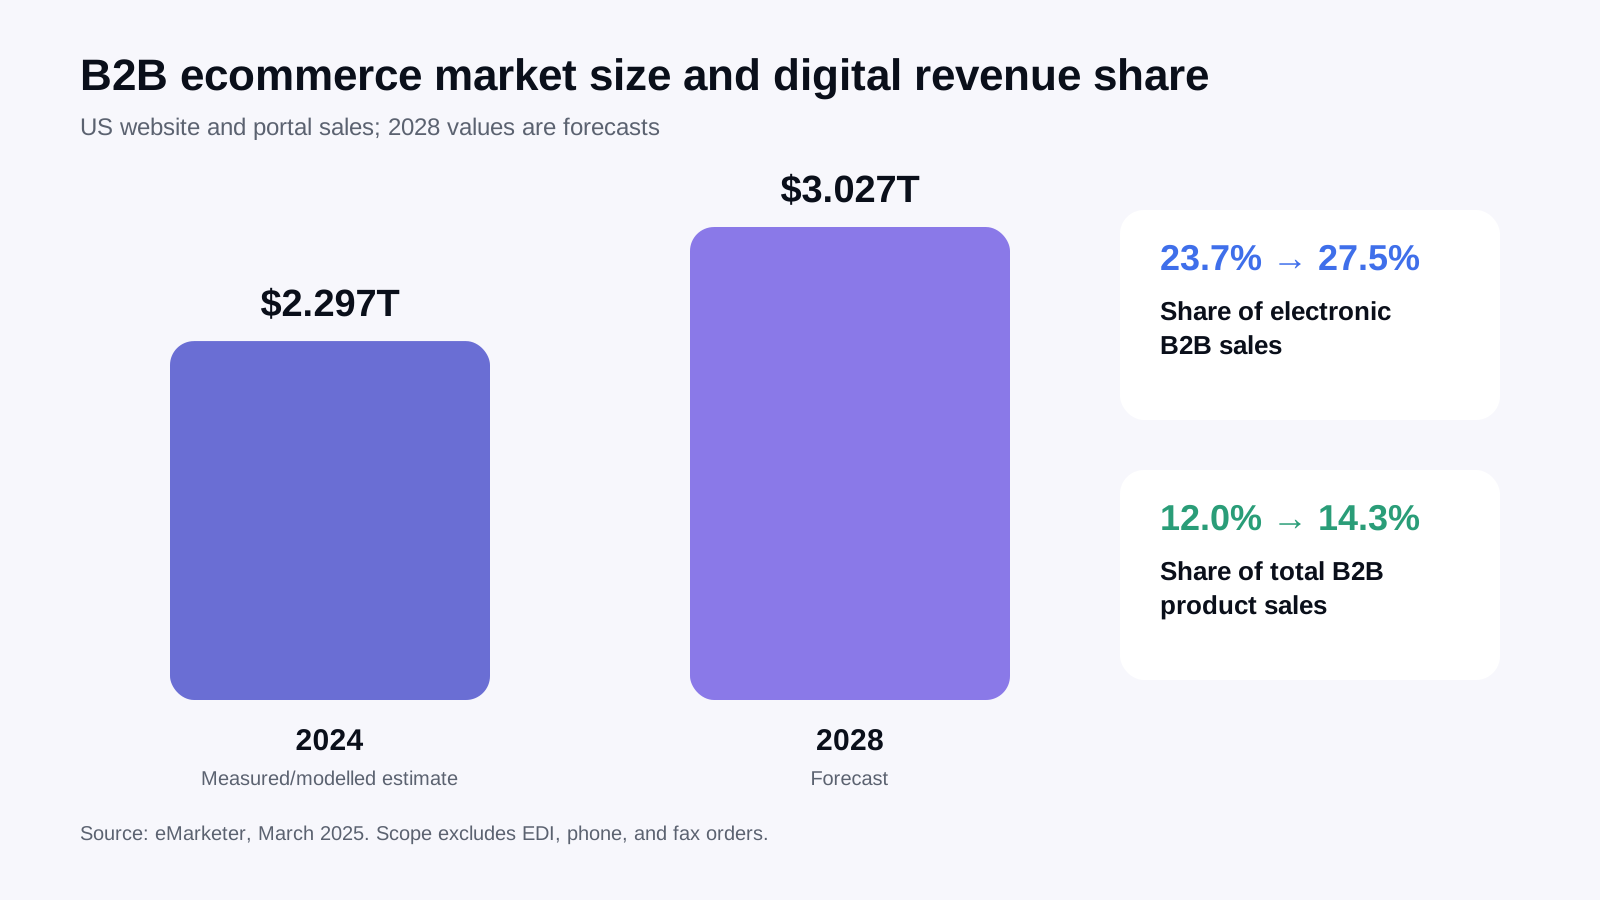
The most defensible current US benchmark is narrower than many global market-size headlines. eMarketer estimates that US B2B ecommerce site sales reached $2.297 trillion in 2024, up 10.5% year over year. It forecasts $3.027 trillion by 2028, with ecommerce sites increasing their share of both electronic B2B sales and total B2B product sales.
| Metric | 2024 | 2028 forecast | Definition |
|---|---|---|---|
| B2B ecommerce site sales | $2.297 trillion | $3.027 trillion | Orders completed through websites and portals; excludes EDI, phone, and fax |
| Share of electronic B2B sales | 23.7% | 27.5% | Website and portal sales as a share of broader electronic B2B sales |
| Share of total B2B product sales | 12.0% | 14.3% | Website and portal sales as a share of total B2B product sales |
Source: eMarketer, March 2025. The 2028 figures are forecasts, not measured outcomes.
Why global B2B ecommerce estimates do not match
Published global estimates can differ by several multiples because they count different transaction types. A web-only estimate may exclude EDI and e-procurement. A broader electronic-commerce estimate may include them. A marketplace GMV estimate may count the full value exchanged across platforms rather than supplier revenue. Geography, currency conversion, industry coverage, and whether a source reports measured data or a forecast add further differences.
| Scope | Usually includes | Often excludes | Best use |
|---|---|---|---|
| Website and portal sales | Orders completed on supplier websites, portals, and ecommerce sites | EDI, email, phone, and fax orders | Digital channel adoption and site-sales benchmarking |
| All electronic B2B | Web, portals, EDI, e-procurement, and extranets | Offline transactions | Electronic trade intensity |
| Marketplace GMV | Transaction value processed through third-party or industry marketplaces | Direct supplier transactions outside the marketplace | Marketplace scale and ecosystem comparisons |
| Global forecast | Modeled future market values across regions and industries | Observed future transactions | Directional planning only |
The US Census Bureau E-Stats program provides official estimates across manufacturing, wholesale, retail, and selected services, but its latest publication reports 2022 activity and is better used for historical scope and sector definitions than for a live 2026 headline. A US International Trade Administration page cites a $36 trillion global B2B ecommerce forecast for 2026. Because the page does not expose a sufficiently traceable primary methodology for that figure, it should be treated as a legacy directional forecast rather than a measured 2026 market size.
Practical rule: never cite a B2B ecommerce market-size number without the geography, year, transaction scope, and evidence type.
B2B buyer behavior and self-service adoption
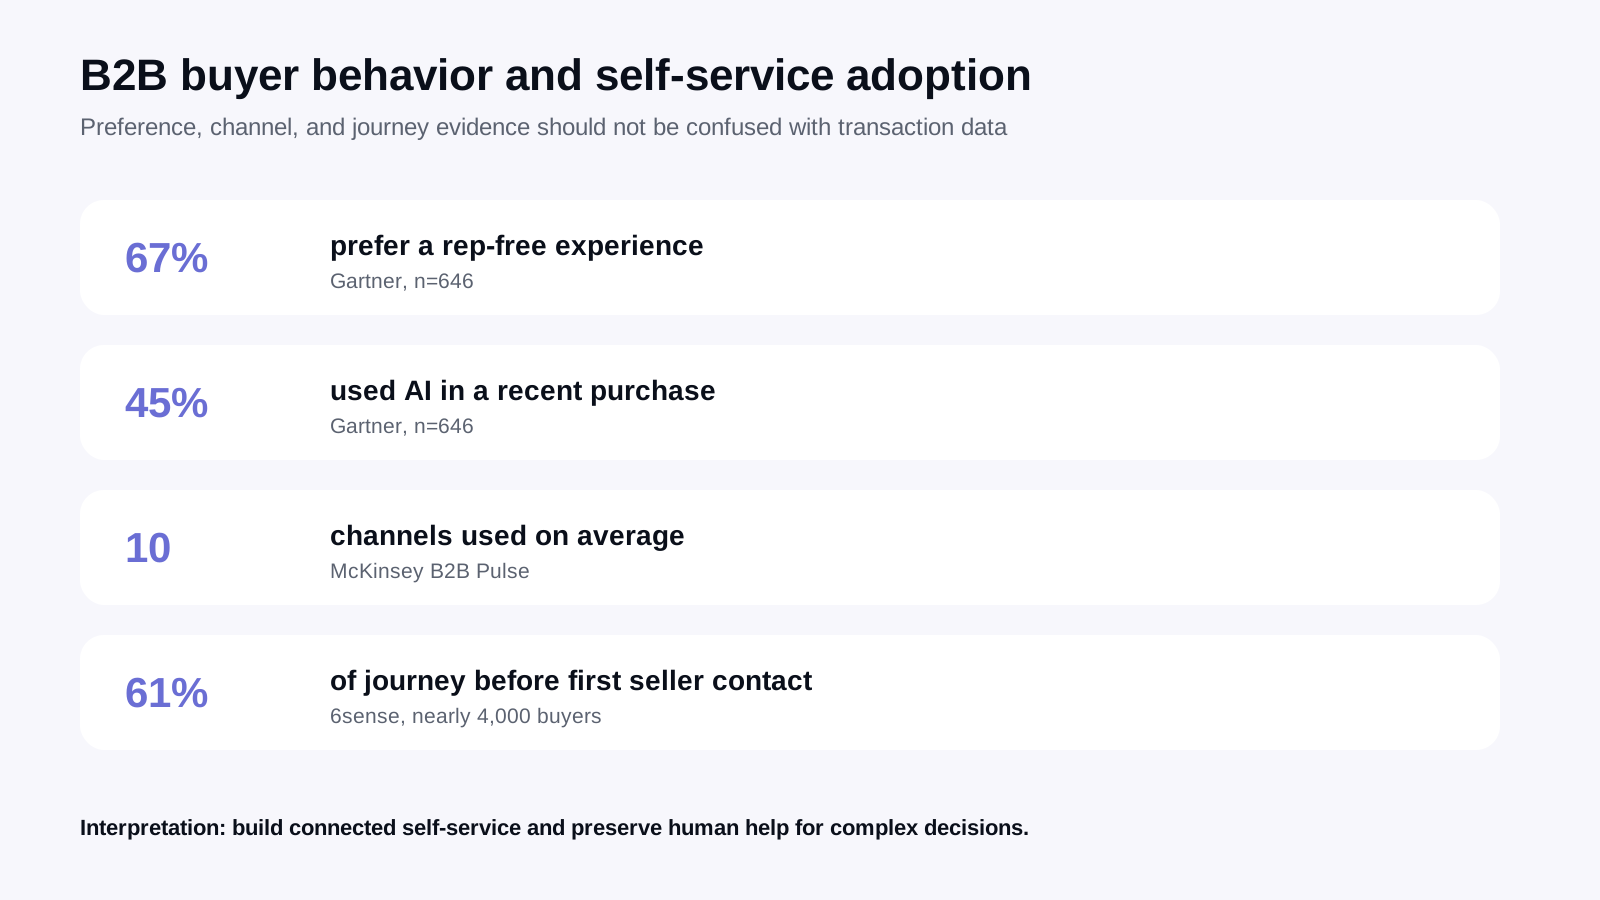
B2B buyers want more control, but not a single-channel journey. McKinsey finds a stable three-way preference split among in-person, remote, and digital self-service interactions. Buyers use an average of ten channels, and more than half want to switch between them without losing continuity. This means self-service should not be designed as an isolated portal. It should share customer, price, product, quote, and order context with sales and service teams.
The early stages of the journey are increasingly private. The 6sense Buyer Experience Report, based on nearly 4,000 B2B buyers, found that first seller contact occurred 61% of the way through the journey. The eventual winner was already on the Day One shortlist in 95% of purchases, and the pre-contact favorite won roughly four out of five deals. Suppliers therefore need to be understandable and credible before a buyer speaks to a representative.
| Signal | Result | What it means for B2B ecommerce | Evidence type |
|---|---|---|---|
| Rep-free preference | 67% | Core research, account management, ordering, and reordering should be possible without mandatory sales contact | Gartner survey, n=646 |
| AI used in a recent purchase | 45% | Product and policy information must be accurate enough to support AI-assisted research | Gartner survey, n=646 |
| Interaction preference | One-third in person, one-third remote, one-third self-service | Do not eliminate human channels; connect them to the same customer and transaction context | McKinsey B2B Pulse |
| Channels used | 10 on average | Continuity across website, sales, service, marketplace, video, email, and in-person touchpoints matters more than channel count | McKinsey B2B Pulse |
| First seller contact | 61% through the journey | Buyers need detailed product, integration, pricing-process, proof, and support information before contact | 6sense vendor research, nearly 4,000 buyers |
| Payment terms | 83% would abandon if terms were unavailable | Credit, net terms, and trade-account workflows can be conversion-critical for eligible buyers | Hokodo vendor-sponsored survey, n=500 UK and Europe |
Preference research should not be confused with transaction logs. A buyer may say that self-service is preferred while still involving a rep for technical validation or negotiated terms. The useful conclusion is not “replace sales.” It is “remove unnecessary dependency on sales while keeping expert help available at the moments where it changes the decision.”
The seven trends changing B2B commerce
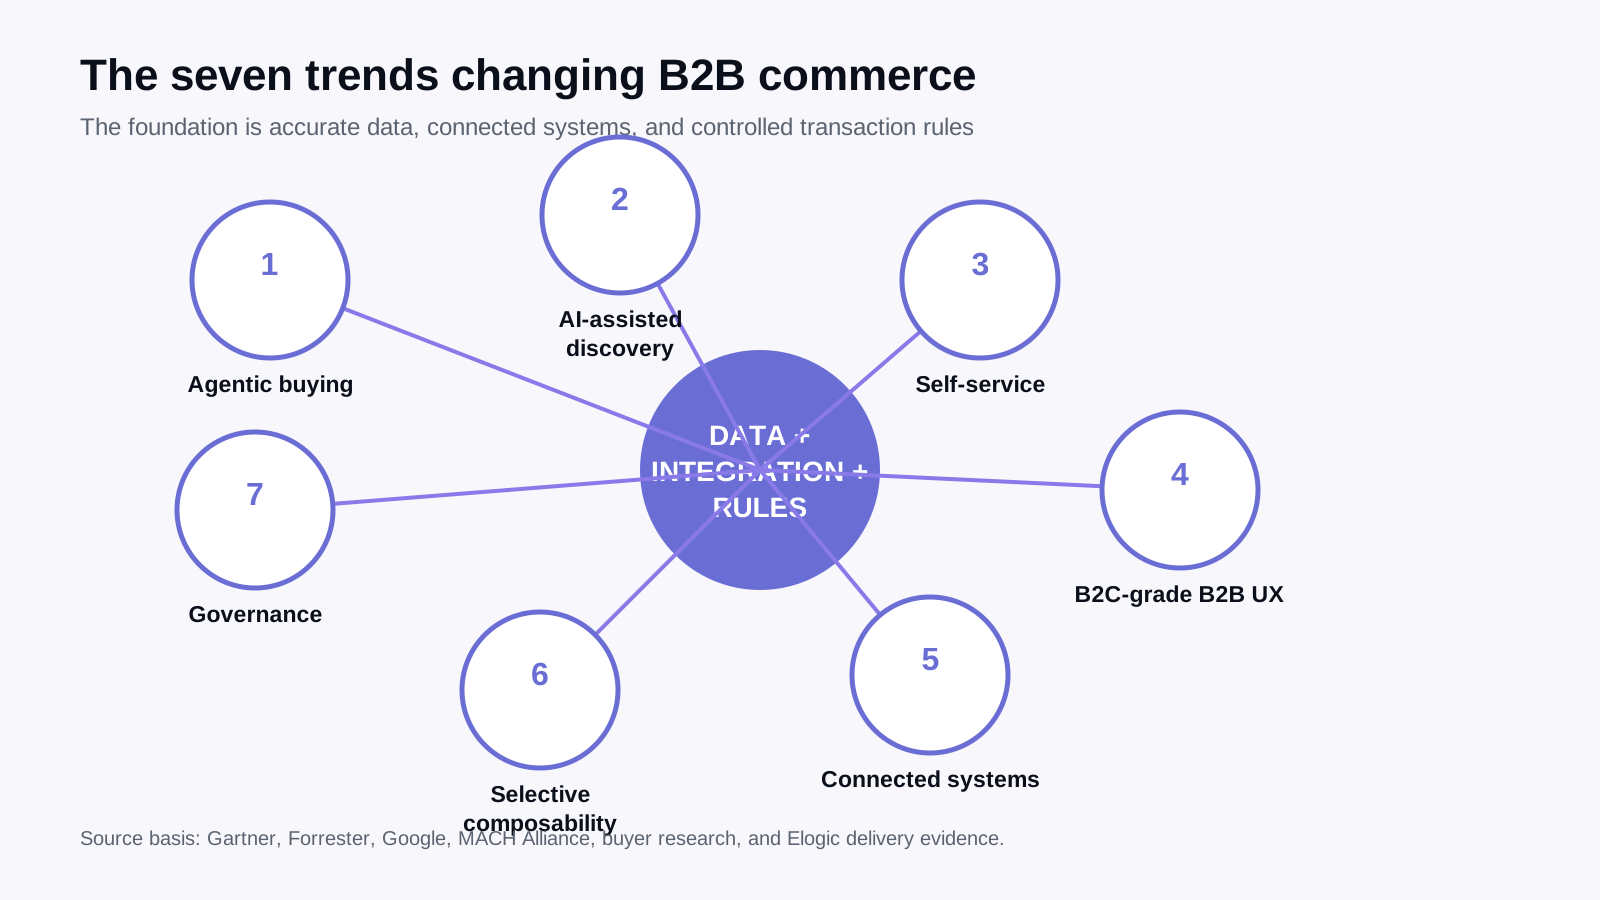
1. Agentic buying enters controlled workflows
Agentic commerce moves AI from recommendation toward action. In B2B, the first credible use cases are bounded tasks: checking contract eligibility, preparing a reorder, comparing approved alternatives, assembling an RFQ, validating availability, or proposing a counteroffer within defined limits. Forrester forecasts that one in five B2B sellers will need to engage with AI-powered buyer agents in 2026, but also reports that true autonomous purchasing is still rare.
The differentiator is not a chatbot. It is whether the commerce stack can expose approved products, account-specific prices, inventory, payment terms, order rules, and exception paths through reliable interfaces. An agent should never invent a price, bypass an approval, or transact outside the buyer’s authority.
2. Product discovery becomes AI-assisted and machine-readable
Buyers increasingly begin research outside the supplier website. Search engines, AI assistants, marketplaces, and procurement tools summarize product facts before a click occurs. Product data therefore needs to be explicit rather than implied: complete titles, normalized attributes, units, compatibility, technical specifications, certifications, GTINs or MPNs where relevant, availability, and factual descriptions.
Google’s merchant-listing documentation shows how structured product information can expose price, availability, shipping, and return details to search experiences. Markup cannot repair inaccurate source data, so the first priority is a governed PIM and catalog model. Structured data is the delivery layer, not the source of truth.
3. Self-service becomes the default path for routine work
Self-service is no longer limited to browsing a public catalog. Buyers expect to see their own assortments and prices, create lists, reorder by SKU, upload bulk orders, request or negotiate quotes, review invoices, track fulfillment, manage users, and access documents. The portal should handle routine work while escalating exceptions to the right person.
A usable B2B customer portal is therefore an operational product, not a marketing layer. Its value depends on ERP-backed accuracy, permissions, and workflow ownership.
4. B2C-grade experience is rebuilt around B2B rules
B2B buyers expect fast search, clear navigation, reliable mobile access, transparent status, and low-friction checkout. But copying a retail storefront is not enough. The experience must preserve company accounts, locations, buyer roles, approval thresholds, credit limits, tax rules, negotiated catalogs, contract pricing, partial fulfillment, and sales-rep relationships.
The winning pattern is consumer-grade usability over business-grade logic. Simplifying the interface must not simplify away the rules that make the order valid.
5. ERP, PIM, CRM, OMS, and commerce become one operating system
Disconnected systems limit every other trend. AI cannot recommend an eligible product when the catalog is inconsistent. Self-service cannot build trust when inventory is stale. A portal cannot support account-specific pricing when contract rules remain in spreadsheets or sales inboxes.
Successful ecommerce systems integration starts by assigning a system of record for products, prices, inventory, customers, credit, orders, shipments, invoices, and returns. It then defines synchronization timing, validation, retries, conflict resolution, monitoring, and operational ownership. Integration is not complete when data can move once; it is complete when failures are visible and recoverable.
6. Composable commerce becomes a selective operating model
Composable architecture is useful when a business needs independent control over storefronts, product data, search, checkout, content, or regional experiences. The MACH principles describe microservices, API-first design, cloud-native SaaS, and headless presentation. These patterns can improve flexibility and independent deployment, but they also increase the number of contracts, interfaces, monitoring points, and ownership decisions.
Composable should be selected when the operating benefit exceeds the coordination cost. A well-governed SaaS or modular monolith may be the better choice for teams that value speed and lower technical overhead. Architecture is a fit decision, not a maturity badge.
7. Governance becomes commercial infrastructure
As more decisions are automated, governance moves from policy documentation into the transaction path. B2B commerce needs identity, role-based access, spend limits, approved suppliers, audit trails, data lineage, privacy controls, model monitoring, fallback procedures, and human review for material exceptions.
Governance also applies to content and statistics. Forecasts must be labeled as forecasts. Buyer surveys must show sample and geography. Case results must remain case-specific. A trustworthy benchmark is more valuable than a larger collection of unsupported numbers.
| Trend | Minimum prerequisite | First metric to track |
|---|---|---|
| Agentic buying | API access to approved products, prices, permissions, and transaction rules | Percentage of agent-assisted tasks completed without manual correction |
| AI-assisted discovery | Structured, governed, complete product data | Coverage of required attributes and specifications |
| Self-service | Account-specific data and workflow support | Active ordering accounts and self-service order share |
| B2C-grade B2B experience | Usability improvements that preserve business rules | Task completion and checkout error rate |
| Connected systems | Defined systems of record and monitored synchronization | Sync failures, stale-data incidents, and manual corrections |
| Composable architecture | Clear component ownership and integration governance | Release lead time and incident rate by component |
| Governance | Permissions, auditability, exception paths, and accountable owners | Policy exceptions and unauthorized-action attempts |
B2B ecommerce implementation cost benchmarks
There is no reliable public cross-platform benchmark that cleanly separates discovery, design, storefront development, B2B workflows, ERP and PIM integration, migration, testing, training, launch, and first-year support. A single “average B2B ecommerce cost” is therefore more likely to mislead than to help.
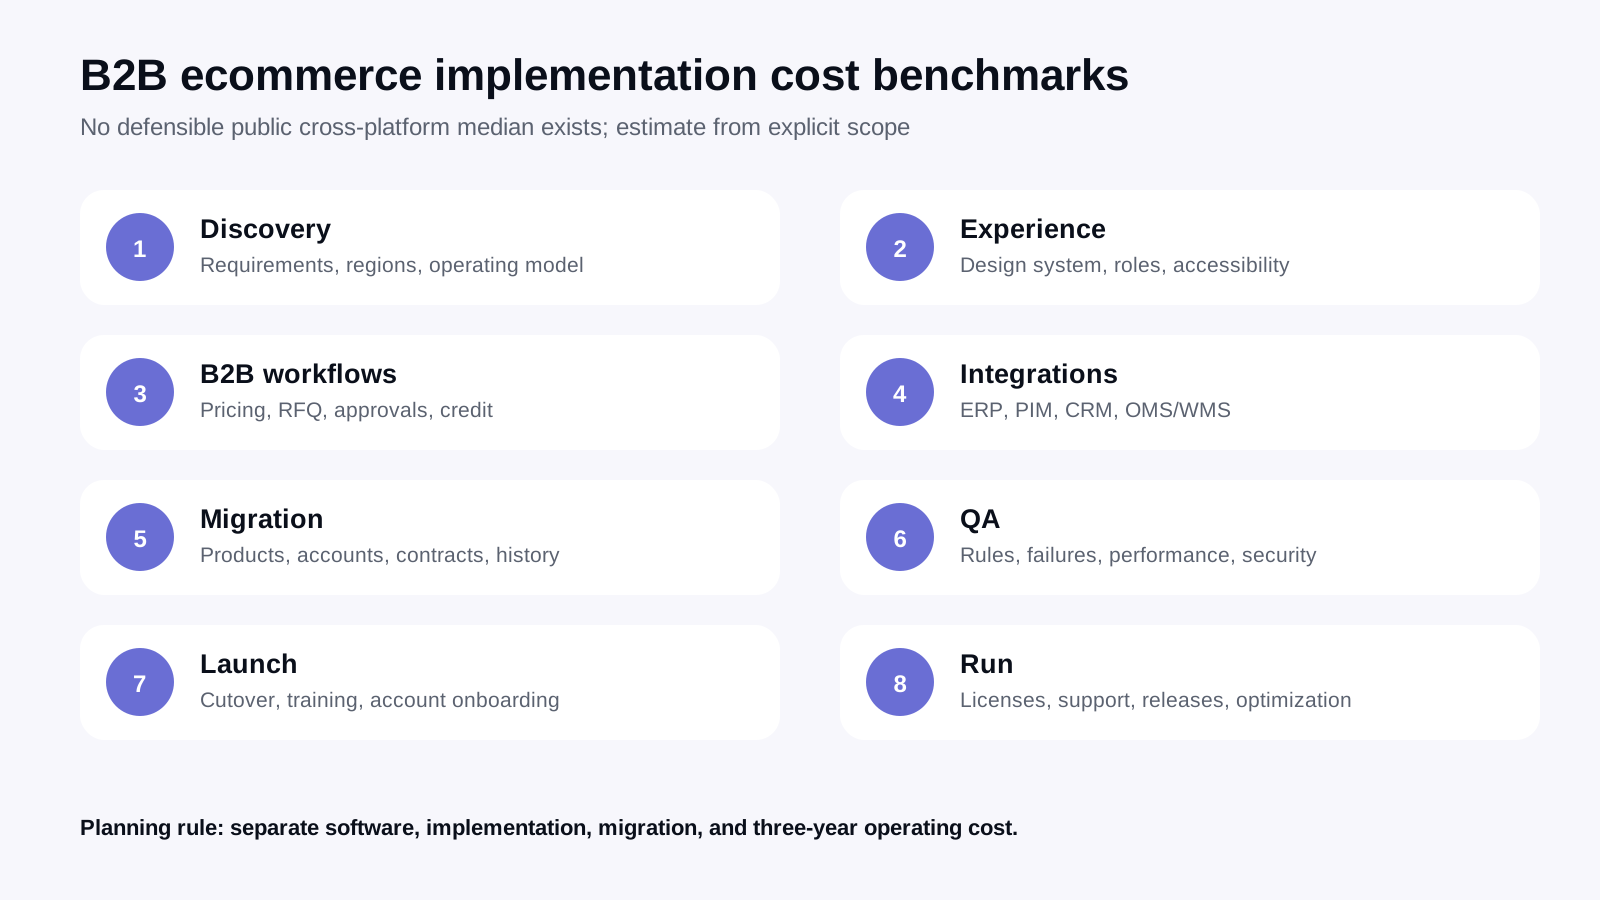
A defensible budget starts with scope. The same platform can support a relatively contained account portal or a multi-region transformation with customer-specific pricing, several ERPs, complex catalog rules, PunchOut, EDI, CPQ, migration, and phased deployment. Those are different programs and should not share one benchmark.
| Workstream | Main cost drivers | Evidence needed before estimating | Common source of underestimation |
|---|---|---|---|
| Discovery and architecture | Regions, brands, business models, workflows, platform options, non-functional requirements | Current-state map, requirements, risk register, target operating model | Skipping decisions that later become expensive changes |
| Experience and frontend | Design system, responsive templates, account journeys, accessibility, localization | Page inventory, component list, user roles, content requirements | Counting pages but not states, permissions, and exceptions |
| B2B workflows | Account hierarchy, pricing, RFQ, approvals, credit, quick order, requisitions, returns | Workflow diagrams, rule ownership, edge cases, approval thresholds | Treating “B2B features” as one configuration item |
| Systems integration | ERP, PIM, CRM, OMS/WMS, tax, payment, EDI, PunchOut, middleware | Object list, system of record, volume, latency, error handling, ownership | Estimating the happy path without retries and exceptions |
| Data migration | Products, attributes, customers, contracts, prices, orders, documents | Source audit, quality report, transformation rules, reconciliation plan | Assuming legacy data is complete and consistent |
| Quality assurance | Role combinations, pricing rules, integration states, performance, security, accessibility | Test matrix, environments, test data, acceptance owners | Testing only storefront pages instead of end-to-end order states |
| Launch and adoption | Training, account onboarding, regional rollout, support, change management | Cutover plan, communication plan, support model, adoption targets | Assuming technical launch automatically creates buyer adoption |
| Run and improve | Hosting, licenses, apps, monitoring, support, releases, optimization | Service levels, release cadence, ownership, three-year roadmap | Comparing build cost without total cost of ownership |
For current planning, use ranges tied to three explicit scenarios: minimum viable rollout, expected program, and high-complexity case. Separate platform and software fees from implementation services and ongoing operations. Model three-year total cost of ownership rather than comparing launch budgets alone. The ecommerce development cost guide provides a broader framework for platform, scope, integration, migration, and support planning.
Implementation timelines: ERP-integrated vs non-ERP projects
There is no defensible public median for B2B ecommerce implementation time that controls for platform, ERP scope, data quality, workflow complexity, regions, and adoption. The most useful comparison is not a universal number but the work that enters the critical path.
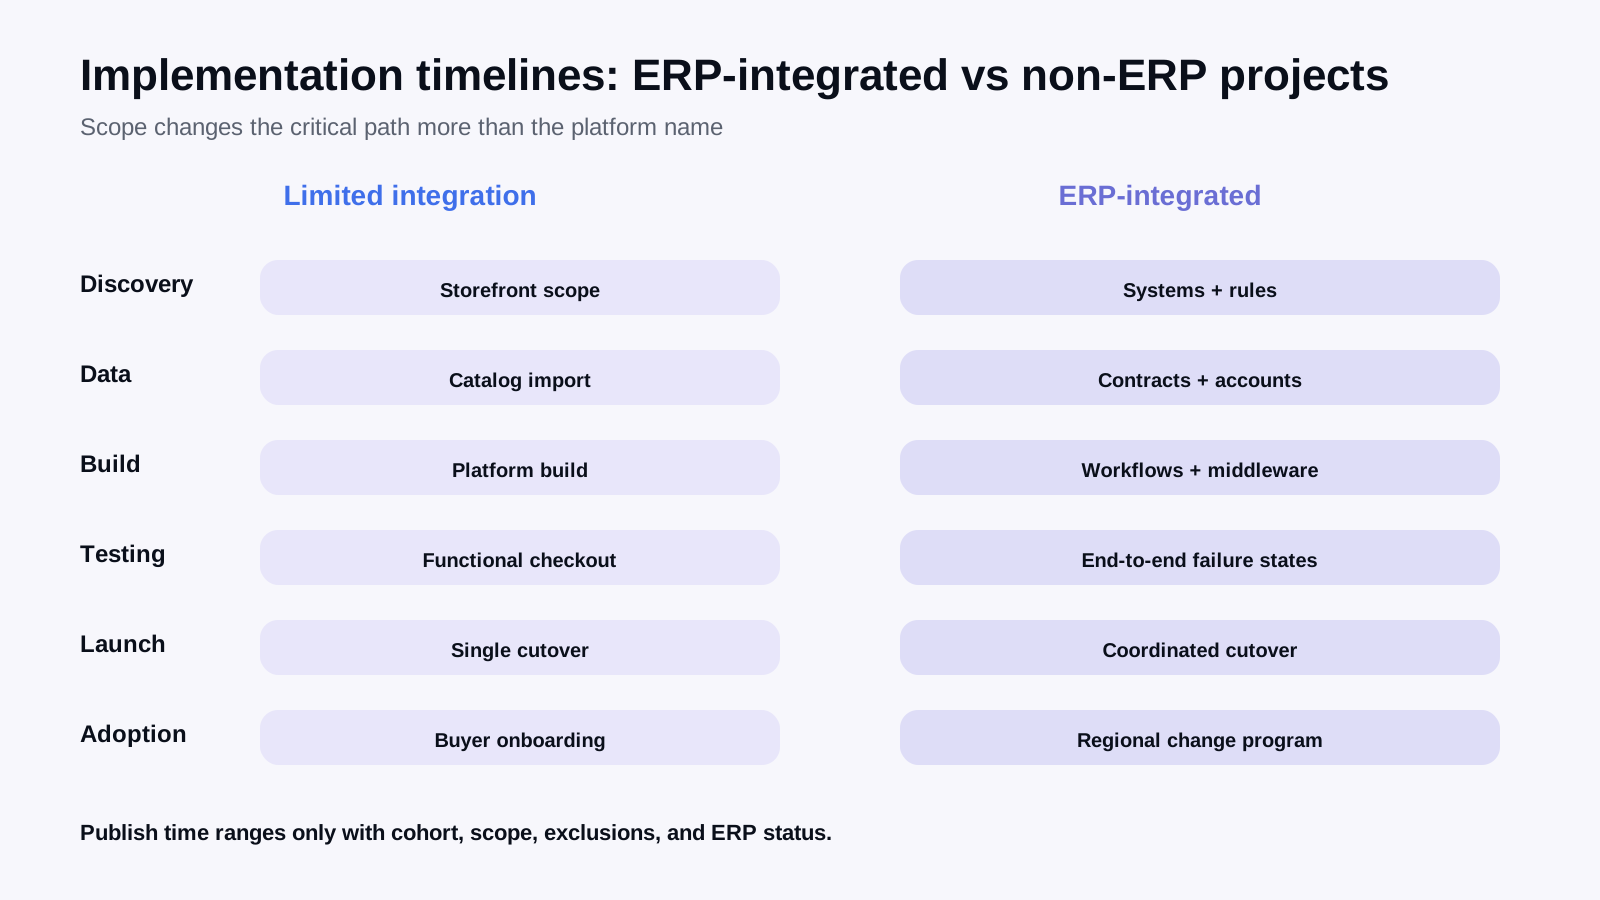
| Phase | Non-ERP or limited-integration project | ERP-integrated project | Release gate |
|---|---|---|---|
| Discovery | Storefront, users, products, standard pricing, basic order flow | Systems of record, object ownership, account rules, pricing, fulfillment, exceptions | Approved scope and architecture |
| Data preparation | Catalog and customer import | Catalog, contracts, account hierarchy, price lists, credit, historical and reference data | Reconciled migration samples |
| Build | Platform configuration, templates, native workflows, selected extensions | Custom B2B workflows plus integration services, middleware, monitoring, and recovery | Feature-complete test environment |
| Testing | Functional, responsive, accessibility, checkout, and content tests | End-to-end tests across pricing, inventory, tax, credit, partial fulfillment, returns, and failure states | Business acceptance and operational readiness |
| Launch | Single cutover or limited phased launch | Coordinated cutover across systems, regions, data, support teams, and fallback paths | Stable transactions and monitored synchronization |
| Adoption | Buyer invitations and standard support | Account migration, sales-team enablement, exception management, regional change program | Target adoption and support levels |
Case evidence demonstrates why scope must be visible. Elogic Commerce launched the PetHQ Shopify Plus wholesale channel in 2.5 months, onboarded more than 1,400 B2B users, and the client reported $1.1 million in new B2B revenue in the first year. This is a single project result, not a universal Shopify Plus or B2B timeline.
By contrast, multi-region programs with ERP and PIM integration are often phased because the operating model, data, and regional rollout continue beyond the first launch. The right timeline should therefore state what is included, what is deferred, and which business and technical gates define “done.”
Budget overruns and the causes behind them
No credible cross-platform public dataset currently provides a comparable B2B ecommerce budget-overrun rate with clear project scope, original budget, change requests, exclusions, and completion status. Instead of repeating an unsupported failure percentage, teams should track the conditions that create overruns and make them visible before the contract is signed.
| Cause | Early warning sign | Control | Accountable owner |
|---|---|---|---|
| Unclear scope and decision rights | Requirements remain broad while estimates are already fixed | Decision log, scope boundaries, assumptions, change-control rules | Business owner and delivery lead |
| Hidden workflow complexity | Pricing, approvals, credit, RFQ, and returns are described as “standard” without diagrams | Map roles, rules, exceptions, and ownership before build | Product owner and business analyst |
| Poor data quality | Sample migrations expose duplicates, missing attributes, invalid accounts, or inconsistent prices | Data profiling, cleansing plan, transformation rules, reconciliation | Data owner |
| Integration assumptions | API availability is assumed; volumes, latency, retries, and failure states are unknown | Integration spike, object matrix, non-functional tests, monitoring design | Solution architect and system owners |
| Extension or app gaps | A feature is sold as native but does not support the required B2B rule or region | Fit-gap validation against real scenarios and official documentation | Platform lead |
| Late business acceptance | Business users see complete workflows only near launch | Early demos, scenario-based UAT, named acceptance owners | Product owner and process owners |
| Underfunded adoption | Training, onboarding, sales incentives, support, and communications are outside scope | Adoption roadmap with account cohorts and measurable targets | Commercial and change leads |
| Big-bang regional rollout | Different markets have unresolved tax, logistics, language, or commercial rules | Phased releases with entry and exit criteria | Program lead and regional owners |
The most effective cost control is not aggressive contingency cutting. It is early evidence: representative data, tested integrations, documented workflow exceptions, and acceptance criteria that describe a working business process rather than a list of screens.
Operational outcomes after a B2B portal launch
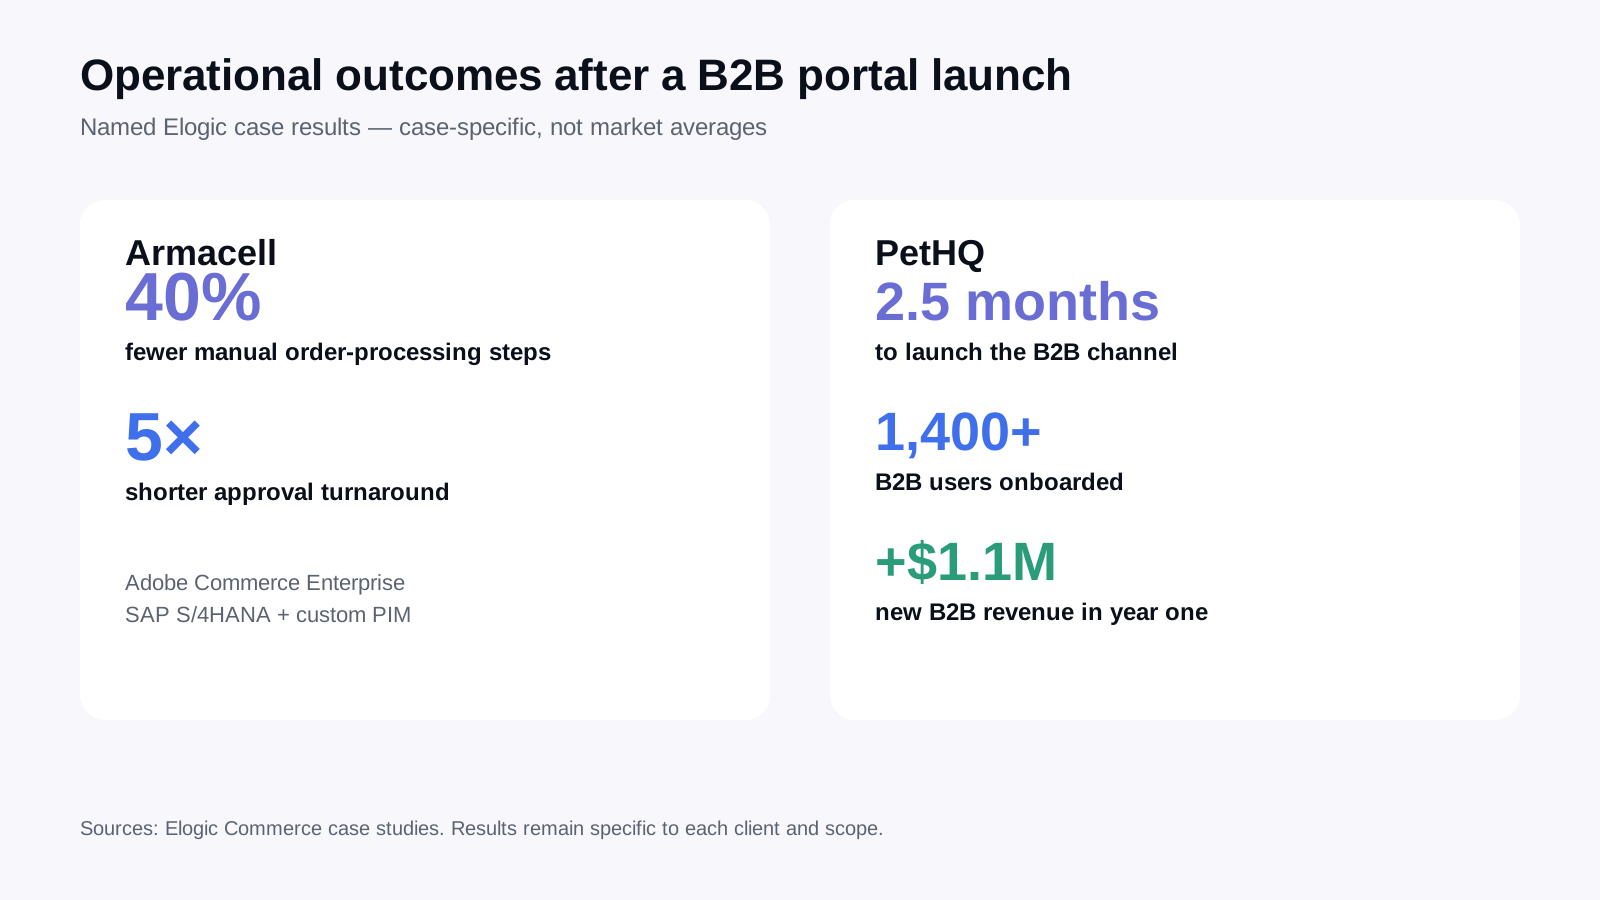
A portal should not be judged only by traffic or launch completion. The relevant outcomes are adoption, revenue migration, order-processing effort, approval time, error rate, support demand, and the percentage of customer tasks completed without avoidable manual intervention.
| Metric | Definition | Why it matters | Required comparison |
|---|---|---|---|
| Digital revenue share | Revenue from digital orders divided by eligible B2B revenue | Shows channel migration and adoption | Before launch, launch cohort, and mature cohort |
| Active self-service accounts | Accounts completing a defined task or order within the period | Separates registered users from real adoption | Invited, activated, active, and ordering accounts |
| Manual-order share | Eligible orders requiring manual re-entry or handling | Measures operational automation | Before and after launch by order type |
| Approval turnaround | Time from submitted order or quote to approval | Shows friction removed from commercial workflows | Median and 25th–75th percentile |
| Support contacts per order | Order-related contacts divided by eligible orders | Measures whether self-service reduces service effort | By issue type and account segment |
| Order error rate | Orders requiring correction, cancellation, or manual repair | Tests data and workflow reliability | By source channel and error cause |
| Repeat-order rate | Ordering accounts that return within the defined interval | Shows whether the portal supports routine purchasing | New and migrated accounts separately |
Armacell: approval and manual-processing outcomes
In the Armacell B2B self-service portal, Adobe Commerce Enterprise was connected to SAP S/4HANA and a custom PIM. During the first months of collaboration, the client recorded a 40% reduction in manual order-processing steps and approval turnaround that became five times shorter. These are client-specific project outcomes and should not be presented as an industry median.
PetHQ: launch, adoption, and revenue outcomes
PetHQ launched a Shopify Plus wholesale channel in 2.5 months, onboarded more than 1,400 B2B users, and reported $1.1 million in new B2B revenue during the first year. The case shows what a focused rollout can achieve when business logic, registration, order quotation, quick order, launch, and post-release support are included in one delivery scope. It does not establish a universal platform timeline or revenue benchmark.
B2B conversion and RFQ-to-order benchmarks
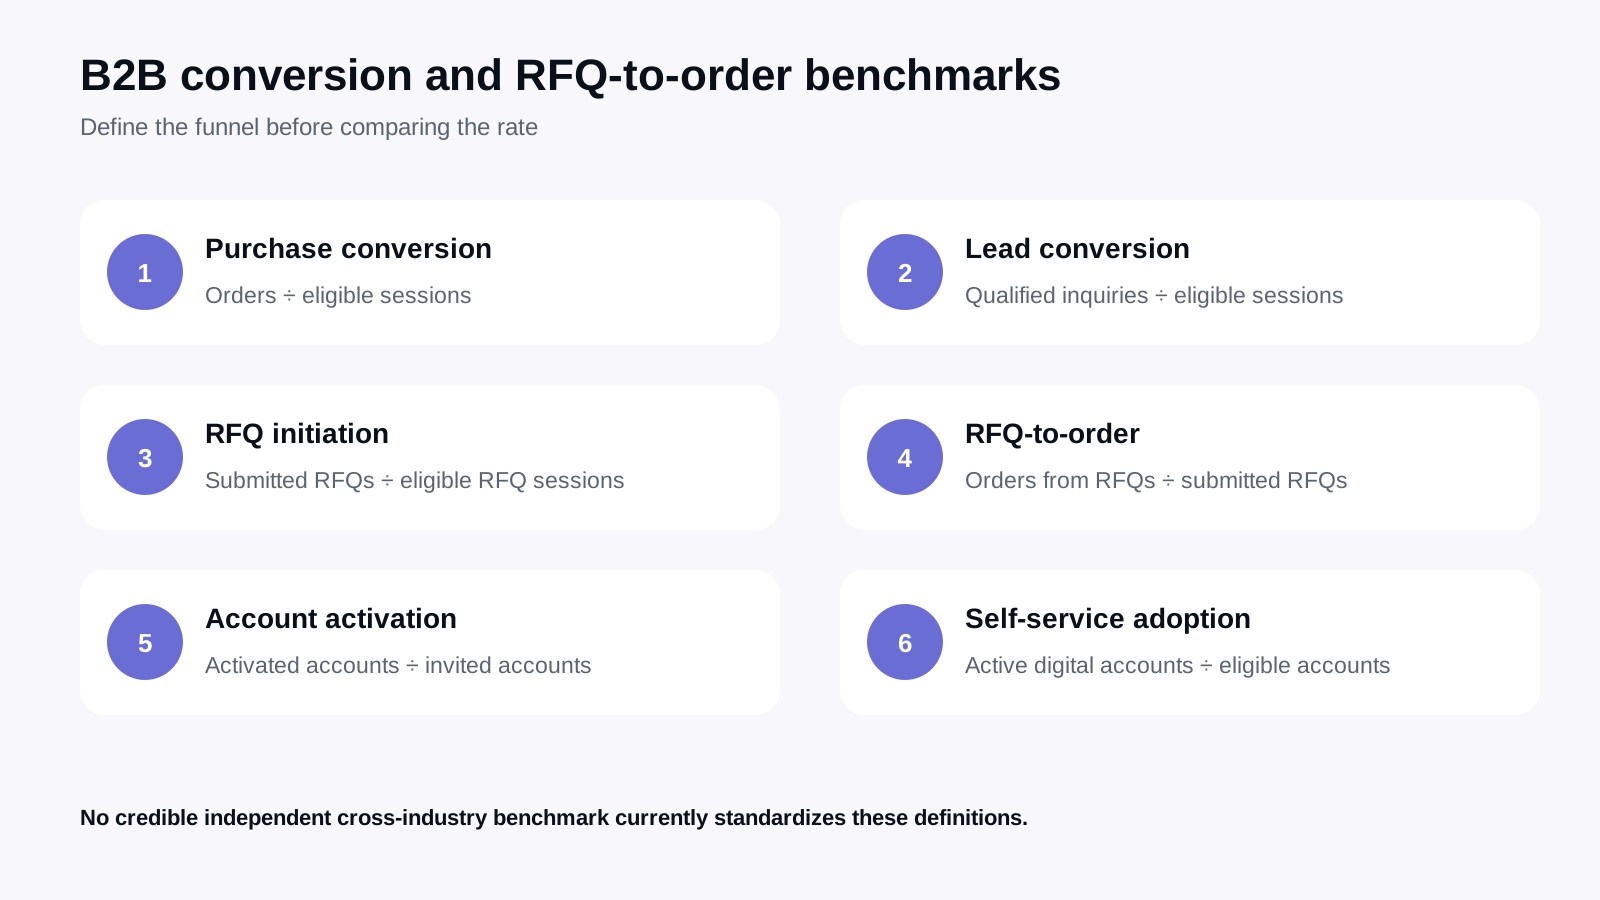
“B2B conversion rate” is not one metric. A logged-in distributor reordering standard products, an anonymous visitor requesting a quote, and a procurement team configuring an engineered product represent different funnels. Combining them into one site-wide percentage produces a number that cannot guide decisions.
| Metric | Formula | Use it for | Do not compare directly with |
|---|---|---|---|
| Purchase conversion | Completed online orders divided by eligible sessions | Transactional catalogs and logged-in ordering journeys | Lead-generation or RFQ-only journeys |
| Lead conversion | Qualified inquiries divided by eligible sessions | High-consideration journeys that require human qualification | Completed purchase conversion |
| RFQ initiation rate | Submitted RFQs divided by eligible RFQ sessions | Custom, configured, negotiated, or unavailable-price products | Standard-cart conversion |
| RFQ-to-order conversion | Orders originating from submitted RFQs divided by submitted RFQs | Quote quality, commercial follow-up, price fit, and approval efficiency | Visitor-to-order conversion |
| Account activation rate | Activated accounts divided by invited or migrated accounts | Portal onboarding | Anonymous traffic conversion |
| Self-service adoption rate | Active self-service accounts divided by eligible accounts | Digital channel migration | Registration count alone |
| Repeat-order rate | Accounts placing another order within the defined period divided by ordering accounts | Retention and routine purchasing | First-order acquisition conversion |
No credible independent public study currently provides a cross-industry B2B checkout or RFQ-to-order benchmark with sufficiently consistent definitions. Public “average conversion rates” should be used only when the source identifies the funnel, audience, traffic denominator, account status, sector, geography, and period.
Checkout research still identifies important friction. In a vendor-sponsored survey of 500 buyers across Europe and the UK, Hokodo reported that 98% experienced at least one online-checkout issue and 83% would abandon a purchase when payment terms were unavailable. This supports testing credit and checkout workflows, but it does not establish a universal B2B conversion rate.
What the data means for manufacturers and distributors
Manufacturers and distributors share many B2B requirements, but their highest-risk workflows are different. Manufacturers often need complex product logic, technical documentation, dealer relationships, CPQ or RFQ, and service or spare-parts journeys. Distributors typically prioritize account pricing, multi-location inventory, fast repeat ordering, sales-rep workflows, credit, invoices, EDI, and PunchOut.
| Dimension | Manufacturers | Distributors |
|---|---|---|
| Catalog | Variants, configurations, compatibility, assemblies, technical documents, certifications, spare parts | Large assortments, substitutes, cross-references, branch availability, pack and unit rules |
| Pricing | Contracts, dealer programs, project pricing, configured or quoted products | Customer price lists, tiers, volume breaks, promotions, margin controls |
| Buyer workflows | Engineer or specifier research, RFQ, approval, dealer ordering, service | Quick order, bulk upload, reorder, approvals, credit, invoice and return management |
| Core integrations | ERP, PIM, CPQ, CRM, document and service systems | ERP, PIM, CRM, OMS/WMS, EDI, PunchOut, tax and payment systems |
| Channel risk | Conflict among direct sales, distributors, dealers, and D2C initiatives | Conflict among branches, sales reps, customer service, marketplaces, and digital self-service |
| First adoption metrics | Digital quote share, configuration completion, dealer adoption, approval time | Self-service order share, repeat orders, manual-order reduction, support contacts |
For manufacturing ecommerce, the first architecture decision should be how ERP, PIM, CPQ, and product documentation support the buying and service journey. For B2B ecommerce for distributors, the first decision is usually how account pricing, inventory, ordering, credit, and fulfillment remain accurate across branches and channels.
A practical rollout sequence for both models is:
- Foundation: define systems of record, product and account data, identity, pricing, and integration ownership.
- Self-service: launch the highest-frequency buyer tasks with reliable status and exception handling.
- Automation: reduce manual validation, order entry, approvals, support contacts, and reconciliation.
- Optimization: improve adoption, conversion, search, content, performance, and account-level economics.
An experienced B2B ecommerce development partner should be able to connect these phases to the real commercial rules and systems, not only to a platform feature list.
Methodology, definitions, sources, and limitations
Methodology: This report separates official statistics, independent analyst research, vendor-commissioned surveys, Elogic Commerce project records, and forecasts. Each data point is tagged by source type, geography, sample size, data period, and confidence. Cost and timeline benchmarks use medians, with the 25th to 75th percentile shown where the sample permits. Client data is anonymized and aggregated. Forecasts are never presented as measured outcomes, and claims without a traceable original source are excluded.
Evidence definitions
| Evidence type | Definition | How it is used |
|---|---|---|
| Official statistic | Government data published with a defined program and methodology | Macro context and historical sector measurement |
| Modeled market estimate | An estimate combining several datasets and assumptions | Current market sizing when scope is explicit |
| Independent survey research | Buyer or seller research with disclosed sample and methodology | Behavior, preference, and channel signals |
| Vendor-sponsored research | Research published or commissioned by a company with a commercial interest | Directional evidence with visible sample, geography, and sponsor caveat |
| Forecast | A modeled future outcome | Scenario planning, never as a measured present result |
| Elogic Commerce project result | A traceable outcome from a named or anonymized client project | Case evidence; not generalized until an approved aggregate cohort exists |
Confidence levels
| Level | Meaning |
|---|---|
| High | Clear scope, traceable source, suitable methodology, and current or regularly updated data |
| Medium-high | Useful primary or longitudinal research with a disclosed sample, but limited by population, geography, or survey design |
| Medium | Directionally useful evidence with sponsor, sample, or comparability limitations that must remain visible |
| Case-specific | Verified for one project or client but not representative of the market |
| Excluded | Untraceable, incorrectly scoped, contradicted by stronger evidence, or presented without an identifiable original source |
Limitations
- Market-size estimates are not comparable unless they use the same geography, transaction scope, period, and currency treatment.
- Buyer preference surveys do not prove that the same share of transactions occurs through the preferred channel.
- Forecasts describe modeled future scenarios and may not be realized.
- Vendor-sponsored studies can be useful when the sample and questions are visible, but commercial incentives must be disclosed.
- There is no current independent cross-platform dataset for B2B implementation cost, timeline, budget overruns, checkout conversion, or RFQ-to-order conversion with consistent definitions.
- Elogic Commerce case results are included only as traceable project evidence and are not presented as market averages.
- Results can vary materially by sector, region, platform, ERP scope, product complexity, business model, buyer population, and data readiness.
Primary sources
- eMarketer: US B2B ecommerce site sales, 2024–2028
- US Census Bureau: E-Commerce Statistics
- Gartner: 2026 B2B buyer survey
- McKinsey: B2B Pulse 2024
- 6sense: Buyer Experience Report 2025
- Forrester: 2026 B2B predictions
- Forrester: State of agentic commerce in mid-2026
- Hokodo: 2024 B2B buyer expectations survey
- MACH Alliance: MACH architecture principles
- Google Search Central: merchant listing product data
Frequently asked questions
What are the biggest B2B ecommerce trends in 2026?
The most consequential shifts are agentic buying, self-service as the default, AI-assisted product discovery, machine-readable product data, composable architecture, connected ERP and PIM systems, and governance for automated transactions.
How big is the B2B ecommerce market?
Market estimates vary because sources define B2B ecommerce differently. Every figure should show the geography, year, channel definition, and whether it is measured or forecast instead of presenting one global number as universally comparable. The strongest current US site-sales estimate is $2.297 trillion for 2024, with $3.027 trillion forecast for 2028.
What does a B2B ecommerce implementation cost?
There is no reliable public cross-platform benchmark that separates storefront, ERP integration, data migration, design, training, and first-year support. A useful estimate must be based on explicit business workflows, integration scope, migration, regions, platform, and operating model rather than one universal average.
How long does a B2B ecommerce project take?
Timeline depends on platform, migration scope, ERP and PIM integration, data readiness, buyer workflows, testing, regional rollout, and change management. Any published range should identify the cohort and clearly separate ERP-integrated from non-ERP projects.
How should journalists cite this report?
Cite the Elogic Commerce B2B Commerce Benchmark Index 2026, the specific chart or table, the data period, and the canonical URL. Preserve the source type and scope beside the statistic so that a forecast or survey is not presented as a measured market result.
Pressure-test your B2B commerce investment
Planning a B2B commerce investment? Use the benchmark to pressure-test scope, budget, platform fit, and integration risk before the RFP.

Get in Touch
Looking for a partner to grow your business? We are the right company to bring your webstore to success.