

Get a summary in:
B2B Ecommerce Conversion Rate Benchmarks 2026
Summary
Key takeaways
- The report’s central point is that there is no single “correct” ecommerce conversion benchmark. The global average in 2026 sits in a 1.4%–3.0% band, and the spread comes from methodology differences, panel bias, and denominator choice rather than true contradiction.
- Industry is the biggest segmentation variable. Food & Beverage leads at 4.5–6.11%, while Luxury & Jewelry sits at 0.87–1.46%, which makes industry-level benchmarking far more useful than relying on a global average.
- Cart abandonment remains stubbornly high at about 70.2%, and the biggest single reason is still unexpected costs at checkout, responsible for roughly 48% of abandonment.
- Page speed is framed as the highest-ROI technical lever. The report cites +8.4% retail conversion lift from a 0.1-second mobile speed improvement, around -7% conversions from a 1-second delay, and roughly 3× higher conversion at 1s vs. 5s load time.
- The mobile–desktop gap has narrowed, but it still matters. Globally, mobile converts at 2.3% vs. desktop at 2.6%, while Shopify data shows a wider gap at 1.2% mobile vs. 1.9% desktop.
- Email is the highest-converting channel, but its benchmarks are frequently misread because sources mix session-based conversion with placed-order rate per recipient. The report stresses that denominator discipline is essential.
- B2B and B2C should not be benchmarked the same way. The report gives B2B purchase ranges such as ~2.2% for manufacturing, ~2.4% for distribution, and ~2.6% for wholesale, but also warns that lead-based B2B metrics are different and should not be averaged together with purchase metrics.
- Platform-level conversion data is much weaker than people assume. Shopify has the strongest published benchmark set, while Adobe Commerce, Salesforce Commerce Cloud, and WooCommerce figures are mostly agency-derived or inferred, so platform averages should be treated as directional.
- The report argues that for mid-market and enterprise merchants, architecture is often a CRO constraint. Broken ERP, OMS, or PIM integrations can suppress conversion more than surface-level UX issues.
- A “good” ecommerce conversion rate depends on industry, platform, device mix, traffic mix, and buying model. On blended session-based reporting, the report frames 2.5%–3.5% as strong, 3.5%–5.0% as top-performer territory, and 5%+ as best-in-class.
When this applies
This applies when you need a grounded benchmark framework for ecommerce performance rather than a single oversimplified average. It is especially useful for teams comparing results by industry, device, traffic source, platform, geography, or B2B vs. B2C model. It also applies when leadership is asking whether low conversion is a CRO problem, a traffic-quality problem, or an architecture problem. The report is built for benchmarking, prioritisation, and interpretation, not just for quoting one headline number.
When this does not apply
This does not apply when someone wants one universal target without segmentation. It is also a weak fit if the business measures success mainly through offline sales, lead qualification, assisted selling, or procurement workflows and still expects a single blended ecommerce conversion figure to explain everything. For B2B especially, the report itself warns that quote flows, repeat accounts, and ERP-mediated orders can make single-session purchase conversion an incomplete measure.
Checklist
- Define your denominator before citing any benchmark.
- Benchmark against your industry first, not the global average.
- Split performance by device, especially mobile vs. desktop.
- Compare conversion by traffic source, not only sitewide average.
- Separate B2B purchase conversion from B2B lead conversion.
- Treat platform-level conversion benchmarks as directional, not absolute.
- Use the 1.4%–3.0% global band as context, not as a target.
- Check whether your store falls into underperforming, average, strong, or top-performer territory only after segmentation.
- Audit page speed, especially mobile load time and Core Web Vitals.
- Review checkout for unexpected costs, forced account creation, and payment friction.
- Improve product data quality, including specs, sizing, fitment, and stock accuracy.
- Evaluate search and filtering if you run a large or complex catalog.
- Add trust signals close to the decision point.
- For B2B or enterprise stores, audit ERP, OMS, and PIM integration quality.
- Weight your own historical trend more heavily than any external benchmark.
Common pitfalls
- Treating one published number as the universal ecommerce conversion rate.
- Mixing sessions, unique visitors, filtered sessions, and email recipient-based metrics in the same comparison.
- Comparing B2B lead conversion directly with B2B purchase conversion.
- Using platform averages as proof that one platform “converts better” in all cases.
- Ignoring industry spread, even though it is the strongest source of benchmark variance.
- Looking only at blended CVR and missing mobile-specific underperformance.
- Treating cart abandonment as a UX-only issue while hiding pricing or checkout transparency problems.
- Assuming CRO is mainly about copy and layout when the root issue is architectural.
- Copying marketplace conversion expectations into direct-to-site ecommerce analysis.
- Benchmarking against “everyone” instead of against your actual business model, traffic mix, and customer behavior.
1. Executive summary
The global average ecommerce conversion rate in 2026 sits in a 1.4%–3.0% band, depending on the dataset and how you count. That spread is not a contradiction — it is a methodology artefact. Different sources count sessions, unique visitors, or filtered sessions; different panels skew toward SMEs or enterprise; different countries dominate different datasets. A single “benchmark” number is misleading. What matters is the right benchmark for your industry, your platform, your device mix, your traffic mix, and your buying model.
This report consolidates the most credible, citable benchmark data published between 2024 and April 2026, drawing on IRP Commerce, Littledata, Dynamic Yield, Statista, Baymard Institute, Klaviyo, Google/Deloitte, Portent, Ruler Analytics, and others. Each benchmark below carries its source and a confidence rating.
Seven takeaways for ecommerce leaders
- Global average ecommerce conversion rate sits in a 1.4%–3.0% band. IRP Commerce’s live panel reports 1.70% for April 2026; Littledata’s Shopify-only benchmark reports 1.4%; Dynamic Yield’s enterprise-weighted panel of 200M+ monthly users reports 2.69%; Statista’s session-based global figure for Q4 2025 is 1.9%. The spread is driven by sample composition and the denominator used.
- The industry gap is the single largest segmentation variable. Food & Beverage peaks at 4.5–6.11% across multiple sources, while Luxury & Jewelry falls to 0.87–1.19%. That is a roughly 5–7× gap on the same definition of conversion.
- Cart abandonment is stable at 70.19%–70.22%, according to Baymard Institute’s 14-year longitudinal meta-analysis of 49–50 studies. Roughly 48% of cart abandonment is caused by unexpected costs at checkout.
- Page speed remains the highest-ROI technical lever. A 0.1-second improvement in mobile load time increases retail conversions by 8.4% (Google/Deloitte). A 1-second delay can cost ~7% of conversions. Sites loading in 1s convert roughly 3× higher than sites loading in 5s (Portent, 27,000-page analysis).
- The mobile–desktop gap has narrowed but persists. Globally, mobile converts at 2.3% versus desktop at 2.6% (Statista, Q4 2024). On Shopify, mobile converts at 1.2% versus desktop at 1.9% (Littledata). Mobile drives 70–73% of traffic but a disproportionately smaller share of revenue.
- Email is the highest-converting marketing channel by a wide margin, but “email conversion rate” is reported inconsistently. Session-based email CVR ranges from 2.6% to 9.6%; Klaviyo’s enterprise placed-order-rate metric shows 1.2% for automated flows and 0.05% for one-off campaigns — a 24× gap. Always specify the denominator.
- B2B conversion is structurally different from B2C. Atwix’s 2026 platform-level analysis puts B2B Manufacturing at ~2.2%, Distribution at ~2.4%, and Wholesale at ~2.6%. Ruler Analytics reports B2B lead conversion at ~2.9% across 14 industries — but lead-based and purchase-based B2B benchmarks should not be compared directly.
If your store is converting at the global average, you are not benchmarking against your competition — you are benchmarking against everyone else’s competition. The right comparison is your industry, your device mix, your platform, and your traffic mix.
2. Quick answer — the average ecommerce conversion rate in 2026
The average ecommerce conversion rate in 2026 is between 1.4% and 3.0%, depending on which dataset you cite. Four widely-used reference points:
- IRP Commerce (live panel, April 2026): 1.70% — cross-industry, UK-weighted, SME-heavy, session-based.
- Littledata (Shopify, 2025): 1.4% median — opt-in Shopify merchants, server-side GA4 tracking, session-based.
- Dynamic Yield (rolling 2025–2026): 2.69% — enterprise/mid-market, 200M+ monthly unique users, filtered sessions.
- Statista (Q4 2025, global): 1.9% — aggregated third-party panel, all visits including bounced sessions.
These numbers do not disagree. They measure different populations with different denominators. A useful working benchmark is 2%–3% for established merchants on session-based reporting, with the right answer for any specific store depending on industry, device, channel, and platform — which the rest of this report breaks down.
Methodology note. Throughout this report, all benchmarks are session-based unless explicitly stated. Where a source uses a different denominator (e.g. unique visitors, placed-order rate per recipient, qualified leads), it is noted in the row.
3. Master benchmark table
The single table most readers will return to. Every row carries its source and a confidence rating. “Confidence” reflects sample size, methodology transparency, and how recent the underlying dataset is.
| Metric | Benchmark | Segment | Source | Confidence |
|---|---|---|---|---|
| Global avg. ecommerce CVR | 1.70% | Live panel, all sectors, session-based | IRP Commerce, Apr 2026 | High |
| Global avg. ecommerce CVR | 1.4% | Shopify merchants, session-based | Littledata, 2025 | High |
| Global avg. ecommerce CVR | 2.69% | Enterprise / mid-market, filtered sessions | Dynamic Yield, 2025–26 | High |
| Global avg. ecommerce CVR | 1.9% | All ecommerce, all visits | Statista, Q4 2025 | High |
| Established stores avg. | 2.5–3.0% | Blended, excludes new stores | Red Stag / Immerss aggregate | Medium |
| Shopify top 20% threshold | ≥3.2% | Shopify merchants | Littledata, 2025 | High |
| Shopify top 10% threshold | ≥4.7% | Shopify merchants | Littledata, 2025 | High |
| BigCommerce avg. CVR | 2.5% | BigCommerce platform | Coalition Technologies, 2025 | Medium |
| Magento (B2B) avg. CVR | 2.5% | Magento / Adobe Commerce B2B | Atwix, Jan 2026 | Low–Med |
| Cart abandonment rate (global) | 70.22% | Aggregate, 49–50 studies | Baymard Institute, 2025–26 | Very High |
| Cart abandonment rate (mobile) | 80.2% | Mobile devices | Gauss / SaleCycle, 2024 | Medium |
| Checkout completion rate | 47% avg; 60%+ top | Global ecommerce | Industry aggregate, 2025 | Medium |
| One-page checkout lift | +7.5–10% CVR | Shopify stores | Shopify platform data | Medium |
| Mobile CVR (global) | 2.3% | All ecommerce | Statista, Q4 2024 | High |
| Desktop CVR (global) | 2.6% | All ecommerce | Statista, Q4 2024 | High |
| Tablet CVR (global) | 2.9% | All ecommerce | Statista, Dec 2024 | High |
| Page speed: 0.1s improvement | +8.4% retail CVR | Mobile, retail panel | Google / Deloitte, 2020 | Very High |
| Page speed: 1s delay | −7% conversions | General ecommerce | Industry consensus | High |
| 1s vs. 5s load time | 3× higher CVR at 1s | 27,000 landing pages | Portent, 2022 | High |
| Personalization lift | +26–40% CVR | Platform aggregate | Platform vendor data | Medium |
| Site search users CVR | 4.63% vs. 2.77% | Searchers vs. non-searchers | Econsultancy (HelloRetail) | Medium |
| Unexpected costs at checkout | 48% of abandonment | Global ecommerce | Baymard / Swell, 2025 | High |
| Free shipping CVR lift | +15–30% | Category-dependent | Industry consensus | Medium |
Sources cited in this table are listed in full with URLs in Section 14 (Methodology).
4. Ecommerce conversion rate by industry

Industry is the largest single driver of conversion rate variance. The data below synthesises Dynamic Yield’s enterprise panel, IRP Commerce’s live April 2026 panel, Statista Q4 2024, and platform-level benchmarks from Atwix, Red Stag, and Polar Analytics. Ranges reflect cross-source disagreement; where sources converge, ranges narrow.
| Industry | CVR range | Top performers | Source(s) | Conf. | Key driver |
|---|---|---|---|---|---|
| Food & Beverage | 4.5–6.11% | 6.11%–7.06% | Dynamic Yield, IRP, Red Stag | High | Low AOV, impulse, subscriptions |
| Beauty & Personal Care | 3.3–6.8% | 6.8% | Dynamic Yield, Statista, Convertcart | High | Repeat purchase, brand loyalty |
| Health & Wellness | 3.3–4.55% | 6.5%+ | Red Stag, Atwix | High | Subscriptions, loyalty programs |
| Pet Care & Veterinary | 2.5–4.12% | 7.32% (Mar 2026) | Dynamic Yield, IRP | High | Emotional purchase, reorder |
| Arts & Crafts | 3.0–5.28% | 5.28% | IRP Commerce, Mar 2026 | High | Niche passion audience, low AOV |
| Multi-Brand Retail | 3.57–4.90% | 5%+ | Dynamic Yield, Red Stag | Medium | Breadth, convenience |
| Subscription ecommerce | 4.31% | — | DigitalApplied, 2026 | Medium | Higher intent at session |
| Consumer Goods (general) | 2.63–3.01% | 4%+ | Dynamic Yield, Red Stag | Medium | Broad category, internal variance |
| Fashion, Apparel & Accessories | 1.45–3.01% | 4.5%+ | Dynamic Yield, IRP, Red Stag | High | Visual merch, sizing friction |
| Toys & Games | 0.9–2.8% | 3.5%+ | Polar Analytics, Convertibles.dev | Medium | Seasonal Q4 spikes |
| Home & Furniture / Garden | 0.9–2.2% | 3.0%+ | Dynamic Yield, Red Stag, Atwix | High | High AOV, long consideration |
| Consumer Electronics | 0.8–1.8% | 2.5%+ | Dynamic Yield, Grow-Conversions | High | Comparison shopping |
| Cars & Motorcycling | 1.08–1.57% | ~2.5% | IRP Commerce, Feb–Mar 2026 | Medium | Research-heavy, mixed sessions |
| Industrial Supplies | ~1.8–2.2% | 3%+ | Atwix, 2025 | Low–Med | Specification, ERP-integrated |
| Automotive Parts | ~1.5–2.5% | 3%+ | Industry aggregate | Medium | Fitment lookup, returns risk |
| B2B Manufacturing | 1.9–2.2% | 3%+ | Atwix, 2025 | Low–Med | ERP integration, mobile |
| B2B Distribution | 2.3–2.4% | 3.5%+ | Atwix, 2025 | Low–Med | Bulk ordering, quick reorder |
| B2B Wholesale | 2.5–2.6% | 4%+ | Atwix, 2025 | Low–Med | Account pricing, catalogs |
| Luxury & Jewelry | 0.87–1.46% | 2%+ | Dynamic Yield, Red Stag | High | Long cycle, offline touchpoints |
How to read this table
The wider the range, the more cross-source disagreement exists. Fashion is a good example: IRP Commerce’s UK-weighted SME panel shows 1.45% while Dynamic Yield’s enterprise panel shows 2.88%. Both numbers are correct for their respective populations. The right benchmark for a mid-market fashion brand sits between them; for an SMB, IRP is closer; for a luxury group operating enterprise platforms, Dynamic Yield is closer.
Food & Beverage and Luxury & Jewellery consistently anchor the top and bottom of the industry distribution across every major dataset. The roughly 5–7× gap between them is the single most cited industry contrast in the literature and is the strongest argument against using a single “average” benchmark.
For complex B2B verticals — manufacturing, distribution, industrial supplies — the underlying datasets are thinner. The Atwix series is the most cited public benchmark, but it is agency-derived without raw data disclosure. Read those rows as directional, not authoritative.
5. Ecommerce conversion rate by device
Mobile drives the majority of ecommerce traffic but consistently converts below desktop. The gap has narrowed since 2020 but remains the largest single optimisation gap most stores face.
| Device | Global avg. | Shopify avg. | Shopify top 10% | Source | Conf. |
|---|---|---|---|---|---|
| Desktop | 2.6% | 1.9% | 6.5% | Statista Dec 2024; Littledata | High |
| Tablet | 2.9% | Not reported | Not reported | Statista Dec 2024 | High |
| Mobile | 2.3% | 1.2% | 3.9% | Statista Dec 2024; Littledata | High |
| Blended | 2.4% | 1.4% | 4.7% | Statista; Littledata | High |
Why mobile converts lower than desktop
Mobile traffic is structurally different from desktop traffic. It includes more discovery-stage sessions, more cross-device handoffs (research on mobile, purchase on desktop), and more interruptions. The on-device factors that depress conversion are well-documented:
- Smaller viewport increases tap-target friction and form-field error rates.
- Mobile checkout typically requires more taps and more autofill reliance than desktop.
- Page load time on mobile networks is more variable; the speed–conversion sensitivity is larger on mobile than on desktop.
- Wallet adoption (Apple Pay, Google Pay, Shop Pay) closes some of the gap — WooPayments has reported up to +35% mobile CVR with wallet checkout enabled — but adoption remains uneven across categories.
- Mobile cart abandonment runs at roughly 80.2% versus ~69% on desktop (Gauss / SaleCycle, 2024) — directionally consistent with Baymard’s aggregate.
The practical implication. Mobile is typically 70–73% of sessions and 50–60% of revenue. Closing 25% of the desktop–mobile CVR gap is usually a larger revenue lever than improving any other channel — and the data is unambiguous about where the friction sits.
6. Ecommerce conversion rate by traffic source
Traffic source is the second-largest source of CVR variance after industry. Intent differs dramatically between channels: a direct visitor is already brand-aware; a paid social click is interrupted in another context.
| Channel | CVR range | Notes | Source | Conf. |
|---|---|---|---|---|
| Email — automated flows | 4.0–9.6% (session); 1.2% (placed-order) | Flows outperform campaigns 13–24× | Ruler Analytics; Klaviyo; Promodo | High |
| Email — campaigns | ~2.6% (session); 0.05% (placed-order) | Broadcast lower-intent vs. flows | Ruler Analytics; Klaviyo | High |
| Direct | 2.2–3.5% | Brand-aware visitors, high intent | Ruler Analytics; Elogic | High |
| Referral | 2.9–5.4% | Trust transfer from referrer | Red Stag; SQMagazine | Medium |
| Organic Search | 2.1–4.0% | Wide variance by query intent | Elogic; Charle | High |
| Paid Search (PPC) | 1.4–3.2% | Intent match & LP quality dependent | Elogic; Ruler Analytics | High |
| Paid Social (Meta) | 0.5–1.5% | Interruptive, awareness-skewed | Elogic; SQMagazine | High |
| Social (organic) | ~0.7% | Awareness, not conversion channel | SQMagazine | Medium |
| Marketplace (Amazon, eBay) | 10–15% typical | Different denominator — buyer-only audience | Industry consensus | Medium |
Why “email conversion rate” looks contradictory across sources
Promodo cites an email CVR of 9.6% for highly segmented flows. Klaviyo’s 2026 enterprise benchmark shows a placed-order rate of 1.23% for flows and 0.05% for campaigns. These are not contradictory — they measure different things. Session-based CVR counts clicks that lead to purchase; placed-order rate counts purchases as a percentage of recipients. The denominators are different by roughly two orders of magnitude. When citing email benchmarks, always specify the denominator.
Marketplace conversion rates look inflated for the same reason. Amazon’s 10–15% conversion is calculated over an audience that has already typed an intent-laden query into a buying environment. It is not directly comparable to a Shopify session that begins on a marketing page.
7. B2B vs. B2C ecommerce conversion rates
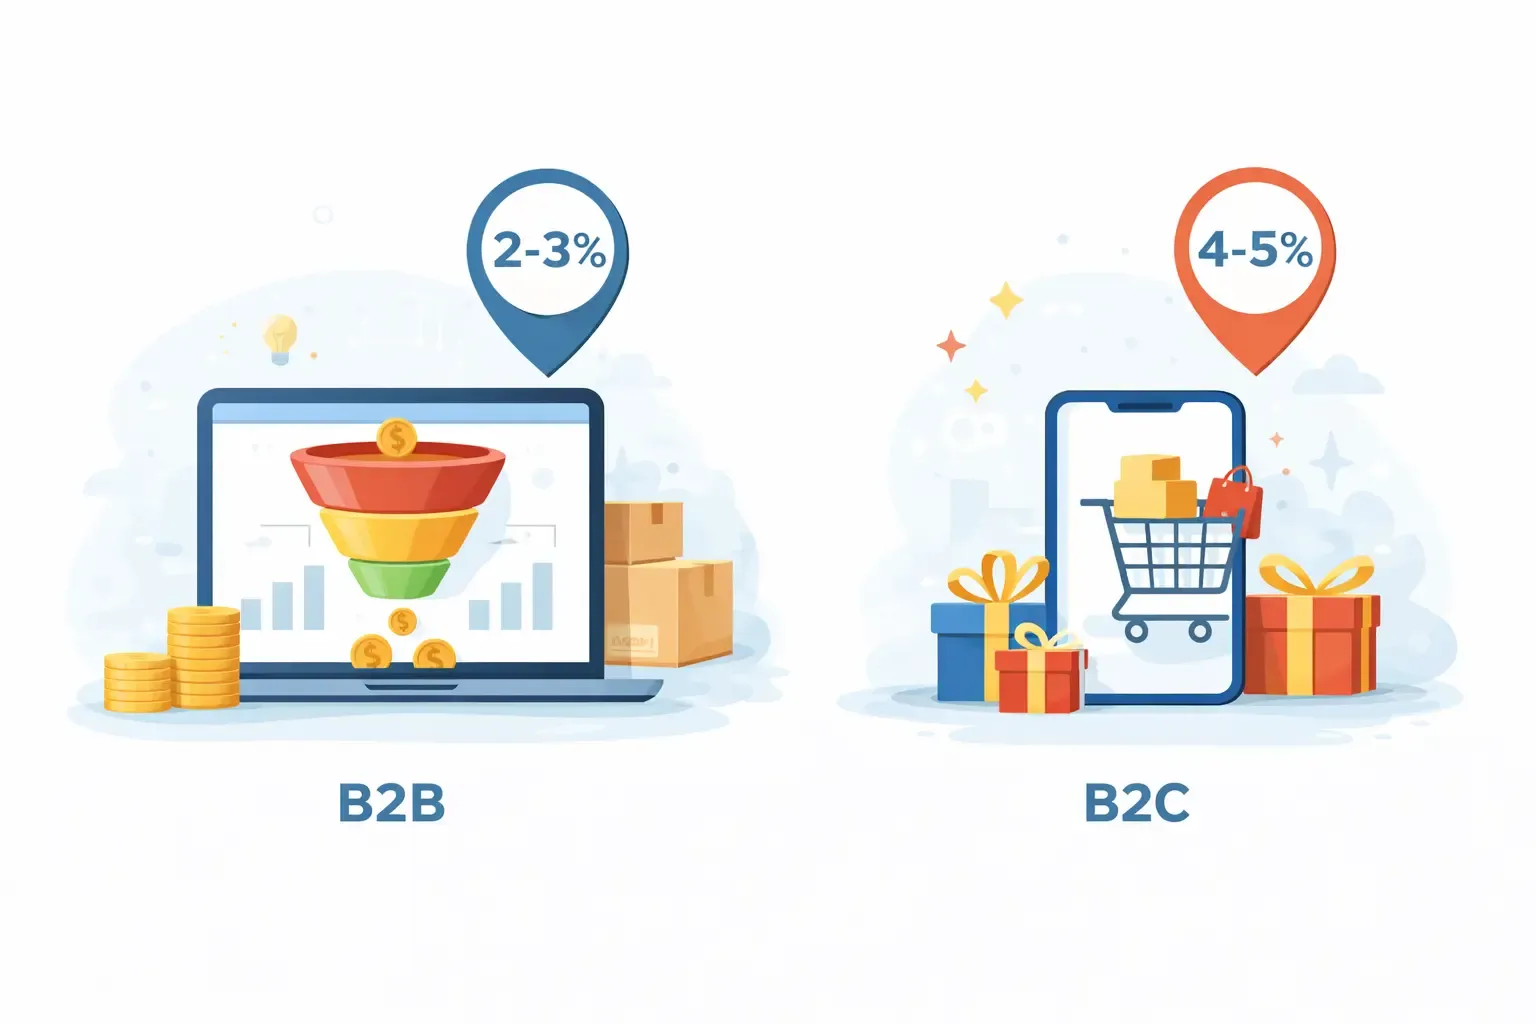
B2B ecommerce conversion is structurally different from B2C — different buying cycle, different decision-maker count, different definition of “conversion” — and most published “B2B conversion rate” benchmarks blur this distinction. The table below separates purchase-based and lead-based metrics explicitly.
| Segment | CVR range | Metric type | Source | Conf. |
|---|---|---|---|---|
| B2C ecommerce (blended) | 2.0–3.0% | Session-to-purchase | Multiple sources | High |
| B2C subscription | 4.31% | Session-to-purchase | DigitalApplied, 2026 | Medium |
| B2B ecommerce (overall) | 1.8–3.0% | Session-to-purchase | Multiple B2B benchmarks | Medium |
| B2B Manufacturing | ~2.2% | Purchase | Atwix, 2025 | Low–Med |
| B2B Distribution | ~2.4% | Purchase | Atwix, 2025 | Low–Med |
| B2B Wholesale | ~2.6% | Purchase | Atwix, 2025 | Low–Med |
| B2B Industrial Equipment | ~1.8% | Purchase | Atwix, 2025 | Low–Med |
| B2B lead-gen (cross-industry) | 2.9% | Visitor-to-lead | Ruler Analytics, Aug 2025 | High |
| B2B visitor-to-lead (general) | 0.8–2.5% | Visitor-to-lead | Zeliq, Dec 2025 | Medium |
Why B2B conversion is structurally different
Six features of B2B commerce systematically suppress the on-session conversion rate compared with B2C:
- Longer buying cycles. B2B purchases often take weeks or months and involve multiple visits. Any single-session conversion rate understates true commercial intent.
- Multiple decision-makers. Procurement, finance, and end-user roles each touch the same journey; conversions are committee outcomes, not individual ones.
- Account-specific pricing. Customer-specific catalogues, contract pricing, and negotiated terms mean that public-facing prices may not reflect the actual transaction. Buyers often request a quote rather than complete a card transaction.
- Quote workflows. “Add to quote” and “request for quote” replace “buy now” in many B2B journeys. These count as conversions in some analytics setups but not in session-to-purchase reporting.
- Procurement approvals. Even after a buyer decides, internal approval workflows can delay the actual order by days or weeks.
- ERP-driven inventory and pricing. The storefront acts as a thin UI over an ERP. If ERP integration is fragile, real-time pricing and availability break, and conversion collapses, regardless of UX quality.
Two structural factors push B2B conversion up rather than down: repeat ordering (loyal accounts visit with high intent) and procurement portal flows (PunchOut, EDI, OCI). Once a B2B account is onboarded, single-session conversion can exceed 10% on repeat-order pathways. The blended B2B average therefore, hides a wide internal distribution between first-time and returning accounts.
For deeper coverage of B2B-specific patterns, see Elogic’s dedicated analysis: B2B ecommerce conversion rate benchmarks 2026.
8. Ecommerce conversion rate by platform
Platform-level CVR is the most opaque category in this report. Only Shopify (via Littledata) publishes a percentile-grade dataset. Other platforms’ figures are either agency-derived or inferred from individual case studies.
| Platform | Avg. CVR | Top performers | Source | Conf. | Caveats |
|---|---|---|---|---|---|
| Shopify (all tiers) | 1.4–1.8% | 3.2% (top 20%); 4.7% (top 10%) | Littledata, 2025 | High | Median includes new / unoptimised stores |
| Shopify (established) | 2.5–3.0% | 5%+ | Shopify Commerce Trends | Medium | “Established” definition varies |
| BigCommerce | 2.5% | Not disclosed | Coalition Technologies, 2025 | Medium | Agency research; no primary link |
| Magento / Adobe Commerce (B2B) | 2.5% | 3%+ | Atwix, Jan 2026 | Low–Med | Agency analysis of B2B; no raw data |
| WooCommerce | ~1.5–2.5% | Not disclosed | Industry consensus | Low | No platform-level data published |
| Salesforce Commerce Cloud | 2.5–3.6% | ~4%+ | Adobe / Magneto IT Solutions | Low | No standalone SFCC dataset |
Data gap alert. No first-party CVR benchmark is publicly disclosed by Adobe Commerce, Salesforce Commerce Cloud, or WooCommerce for their full merchant base. Available figures are agency-derived or inferred. Treat platform-level comparisons as directional.
The most defensible interpretation of platform-level CVR is that platform does not predict conversion — implementation does. A well-architected Magento B2B store can convert at 4%+; a poorly-architected Shopify Plus store can sit below 1%. Headline platform averages reflect the merchant mix more than the platform itself. For replatforming decisions, focus on architecture fit, integration cost, and total cost of ownership — not on the published average CVR of either platform.
See related Elogic resources: Adobe Commerce development, Shopify Plus development, and ecommerce replatforming and migration.
9. Ecommerce conversion rate by geography
Country-level CVR data is thinner than industry or device data. The two most credible sources are Statista (session-based, global panel) and Landmark Global (cross-country aggregate). The table below combines both.
| Country / Region | CVR | Period | Source | Conf. | Notes |
|---|---|---|---|---|---|
| United Kingdom | 1.94–4.1% | Q4 2024 / 2025 | Statista; Landmark Global | High | Top-converting major market |
| United States | 1.96–2.3% | 2024–25 | Landmark Global | Medium | World’s 2nd-largest market by revenue |
| Switzerland | 2.7–2.9% | Q4 2024 | Statista; Landmark Global | Medium | Small market, high income |
| Germany | ~2.22% | 2024–25 | Landmark Global | Medium | Largest EU market |
| Australia | ~1.78% | 2024–25 | Landmark Global | Medium | Directional |
| France | ~1.10% | 2024–25 | Landmark Global | Low | Below EU avg |
| Italy | ~0.99% | 2024–25 | Landmark Global | Low | Lowest reported Western market |
| Americas (aggregate) | 3.14% | 2025 | Nector.io aggregate | Low–Med | Methodology unclear |
| Global (all regions) | 1.6–1.9% | Q3–Q4 2025 | Statista | High | Session-based; all-visit denominator |
The UK consistently appears as the top-converting major Western market, which reflects mature ecommerce infrastructure, high mobile commerce maturity, and strong wallet adoption (Apple Pay, Google Pay, Klarna). Italy and France appear at the bottom of the Western European distribution — likely a combination of payments friction, returns expectations, and category mix.
EU country-level granularity is the largest geographic data gap. Country-level data for Spain, Netherlands, Poland, and the Nordics is not consistently reported across the major panels.
10. What affects ecommerce conversion rate
Eleven factors materially affect ecommerce conversion rate. They are listed below in approximate order of impact, with the magnitude of effect drawn from primary studies where available.
10.1 Page speed
Page speed is the most consistently demonstrated single lever on conversion rate. The headline findings:
- A 0.1-second improvement in mobile load time increases retail conversions by 8.4% (Google / Deloitte, controlled study, 37 retail and travel brands).
- A 1-second delay can reduce conversions by approximately 7% (industry consensus, multiple primary studies).
- Sites loading in 1 second convert roughly 3× higher than sites loading in 5 seconds (Portent, 27,000-page analysis, 2022).
- Portent’s data shows ecommerce CVR at 3.05% for 1-second load times falling to 0.67% at 4 seconds — a 78% drop on a 3-second slower experience.
- 53% of mobile users abandon a page that takes more than 3 seconds to load (Google internal data).
Page speed is also the most actionable lever because it can typically be improved without changing UX, copy, pricing, or merchandising. For Magento and Adobe Commerce merchants, the Hyvä frontend is now a well-documented path to substantial Core Web Vitals improvements.
10.2 Checkout complexity
Baymard’s optimised-checkout research suggests up to +35% CVR is possible from checkout improvements alone, on stores with a poor baseline. The most-cited specific findings:
- One-page checkout converts approximately 7.5–10% better than multi-page on the Shopify platform data.
- Unexpected costs at checkout (shipping, taxes, fees) account for roughly 47–48% of all cart abandonment — the single largest abandonment cause.
- Forced account creation accounts for roughly 26% of cart abandonment (the second-largest reason).
- Adding wallet payment options (Apple Pay, Google Pay, Shop Pay) has been associated with up to +35% mobile CVR in the WooPayments case data.
- Offering BNPL options (Affirm, Klarna) has been associated with +20% CVR and +85% AOV in vendor case data — directional, vendor-sourced.
10.3 Product information quality
Rich, accurate product data reduces decision risk. The strongest indicators are inventory accuracy, sizing data, fitment data (for parts and accessories), and structured specifications. Product information quality is also the single most ERP-dependent lever — a PIM that is out of sync with the storefront produces conversion-destroying behaviours like out-of-stock checkout attempts.
10.4 Search and filtering
Site search users consistently convert at higher rates than non-searchers. The most-cited figure is 4.63% versus 2.77% (1.67× lift), with stronger lifts (1.8–3×) reported on stores with AI-powered or semantic search. Search users also spend roughly 2.6× more per order (HelloRetail aggregate). For catalogue-heavy categories, search and filtering are typically the single largest UX lever after speed.
10.5 Inventory visibility
Out-of-stock states drop conversion sharply. Bidnamic’s Google Shopping analysis showed conversion drops of up to 80% for ads pointing to products with full stock-out across sizes. The on-site equivalent — letting users browse and add to cart products that are not actually purchasable — is worse: it consumes session intent that could otherwise have converted.
10.6 Pricing transparency
Unexpected costs are the largest single cause of cart abandonment (~48%). Stores that surface total cost, taxes, and shipping costs earlier in the journey — ideally at the product page — convert higher. Smarter-eCommerce’s machine-learning study of pricing variables found up to +4% CVR lift for competitive pricing on popular brands and up to +2% CVR lift for clearly-marked large discounts.
10.7 Payment options
Wallet adoption (Apple Pay, Google Pay, Shop Pay) reduces checkout friction substantially, particularly on mobile. BNPL providers (Affirm, Klarna, Afterpay) shift the buying decision from “can I afford this now” to “can I afford this over time”. The CVR lift from each individual payment method is hard to isolate; the cumulative effect of breadth is the more defensible claim.
10.8 Returns policy
Generous, well-communicated returns policies reduce purchase risk. The effect is largest in fashion and apparel (where sizing uncertainty is structural) and in home and furniture (where physical fit drives uncertainty). Returns policy CVR lift is not robustly quantified in public benchmarks; treat as directional.
10.9 Personalisation
Personalisation lift figures must be read carefully because most are vendor-reported. The defensible ranges:
- AI / ML product recommendations: 25–35% of ecommerce revenue at scale (MarketingLTB aggregate).
- Personalised CTAs vs. generic CTAs: up to +202% in vendor case data (Instapage) — directional.
- Personalised email subject lines: ~+26% open rate (Instapage).
- AI-powered search vs. keyword search: 1.8–3× CVR lift for search sessions.
10.10 Trust signals
Reviews, ratings, third-party badges (Trustpilot, BBB, payment-provider logos), security indicators, and clear return/contact information all reduce perceived risk. Trust signal impact is hardest to isolate because it interacts with brand familiarity, but on lower-trust stores, adding visible review aggregation is one of the highest-ROI changes available.
10.11 ERP / OMS / PIM integration quality
This is the lever most ecommerce CRO writing ignores, and the single most common cause of “unfixable” conversion problems on mid-market and enterprise stores. If pricing is wrong, inventory is wrong, lead times are wrong, or customer-specific catalogues fail to load, no UX optimisation will recover the lost conversion. For complex stores, integration quality is a CRO problem, not an IT problem.
11. What is a good ecommerce conversion rate?

There is no universal answer. “Good” depends on industry, platform, traffic mix, device mix, and buying model. The percentile ranges below are directional reference points using session-based reporting on blended traffic — useful for initial orientation, not for setting a target.
| Tier | CVR range | What this typically means |
|---|---|---|
| Underperforming | Below 1.0% | Material conversion problems; typically architecture, speed, or checkout-level. Audit before optimising. |
| Below average | 1.0%–1.7% | Below most published benchmarks. Common for early-stage or non-optimised stores. |
| Average | 1.7%–2.5% | In line with global averages. Room to improve at the device and channel level. |
| Strong | 2.5%–3.5% | Above most blended averages. Likely an established merchant with active CRO. |
| Top performers | 3.5%–5.0% | Top quartile across platforms. Typically high search-intent traffic and mature optimisation. |
| Best-in-class | 5.0%+ | Top decile. Often Food & Beverage, Beauty, or subscription business models. Rare outside high-intent categories. |
Two cautions on this framing:
- These tiers are deliberately wide because they are platform-agnostic. A Shopify store hitting 3.2% is in the top 20% of Shopify (Littledata). A Dynamic Yield-panel enterprise store hitting 3.2% is roughly at the panel average. The same number means different things in different populations.
- In B2B, these tiers do not apply. Single-session B2B conversion rate undercounts commercial activity — quote requests, account-based reordering, and ERP-mediated orders do not show up as session-to-purchase events. Benchmark B2B against B2B sources, not against this table.
12. How to improve ecommerce conversion rate
The tactical playbook below is ordered by typical ROI for mid-market and enterprise stores. It assumes a working baseline — not a launch — and prioritises levers that are well-evidenced in primary research.
Tactical priorities (in approximate order of ROI)
- Improve site speed, especially on mobile. Target Largest Contentful Paint under 2.5 seconds, Interaction to Next Paint under 200ms, and Cumulative Layout Shift under 0.1. For Magento and Adobe Commerce, the Hyvä frontend has become the standard path to substantial Core Web Vitals improvement.
- Simplify checkout. Move to a one-page or step-collapsed checkout. Disclose all costs (shipping, taxes, fees) at the cart or product page. Eliminate forced account creation; offer guest checkout. Add wallet payments (Apple Pay, Google Pay, Shop Pay) and consider BNPL for higher-AOV categories.
- Strengthen product data. Treat the PIM as a conversion asset, not a back-office system. Ensure inventory and pricing accuracy from ERP through to the storefront. Make sizing, fitment, and specifications structured and searchable.
- Improve internal search. Catalogue-heavy stores often see search-driven conversion 1.8–3× higher than non-search. Upgrade to a modern search platform; tune relevance for your category; expose filtering early in the journey.
- Add trust signals at the point of decision. Aggregate reviews on product pages. Surface security indicators and returns policy at the cart. For new brands, third-party trust badges measurably reduce friction.
- Personalise pricing and content where you have data. B2B stores: customer-specific pricing and catalogues. B2C: behavioural recommendations on the home and category pages. Personalisation is a force multiplier, not a foundation.
- Fix inventory and delivery accuracy. Out-of-stock and inaccurate lead time information are conversion-destroying. The fix is almost always integration-layer, not UX.
- Optimise mobile UX as its own surface. Mobile is not a smaller desktop. Re-evaluate tap targets, form fields, autofill behaviour, and wallet placement specifically for mobile sessions.
- Reduce quote and approval friction for B2B. Add quick reorder, saved carts, account-specific catalogues, contract pricing, and clear quote workflows. Mobile-optimise B2B specifically.
- Use CRO testing and analytics with discipline. Statistically significant A/B tests; structured hypothesis backlog; event-level tracking that distinguishes session, user, and account-level behaviour.
Most CRO programs run out of UX-level wins within 12–18 months. The next tier of conversion improvement is architectural — and that is where the multi-million-pound conversion gains hide.
13. The Elogic perspective — architecture as a CRO constraint
Elogic Commerce works primarily with mid-market and enterprise B2B and B2C merchants on Adobe Commerce (Magento), Shopify Plus, BigCommerce, and Salesforce Commerce Cloud. The pattern we observe consistently:
For complex B2B and enterprise ecommerce, conversion rate is often constrained by architecture, not only UX.
The implication: most published CRO advice — checkout layout, button copy, social proof — is downstream of structural decisions the store has already made. When those decisions break, no surface-level optimisation recovers the lost conversion. The architectural levers that matter most:
- ERP integration. Pricing, inventory, lead times, and account data must be consistent across storefront, OMS, and ERP in real time. Integration fragility produces conversion failures that look like UX problems.
- Customer-specific catalogues. B2B accounts often see different product assortments. If catalogue rules are slow or break under load, the conversion gap is structural.
- Contract pricing. Negotiated pricing must be displayed accurately at the product, cart, and checkout layers. Half-implemented contract pricing converts worse than no contract pricing.
- Inventory accuracy, especially for multi-warehouse, multi-region merchants. Stockouts displayed late in the journey are conversion-destroying.
- Checkout logic. Tax, shipping, payment terms, and split shipments must be computed correctly for B2B account contexts. Generic B2C checkout logic is a common cause of B2B conversion drag.
- B2B account workflows. Quote requests, approval chains, reorder flows, PunchOut / EDI integrations — these convert at high rates when they work, and at near-zero when they break.
- Replatforming risk. Many merchants accept persistent conversion drag because the cost of replatforming is perceived to be higher than the cost of the friction. Often, by the time that calculation is done honestly, the merchant has lost two or three years of compounding conversion uplift.
For deeper coverage of these specific patterns, see the relevant Elogic Commerce resources: B2B ecommerce development, Adobe Commerce development, ecommerce replatforming and migration, systems integration, Magento / Adobe Commerce support, and Hyvä development for performance.
13. FAQ
What is the average ecommerce conversion rate?
Between 1.4% and 3.0% globally in 2026, depending on the dataset. IRP Commerce’s April 2026 live panel reports 1.70%; Littledata’s Shopify median is 1.4%; Dynamic Yield’s enterprise panel reports 2.69%; Statista’s Q4 2025 global figure is 1.9%. The spread reflects different populations and denominators rather than a real disagreement.
What is a good ecommerce conversion rate?
On blended session-based reporting, 2.5%–3.5% is strong, 3.5%–5.0% is top-performer territory, and 5%+ is best-in-class — typically only seen in Food & Beverage, Beauty, and subscription business models. Below 1% usually indicates a structural problem rather than a CRO issue. These ranges are directional; benchmark against your industry, platform, and traffic mix rather than a single number.
Which industry has the highest ecommerce conversion rate?
Food & Beverage consistently leads across major datasets, at 4.5%–6.11%. Beauty & Personal Care, Health & Wellness, and subscription ecommerce are the next strongest categories. Luxury & Jewelry is at the opposite end of the distribution, at 0.87%–1.46%.
Why is mobile ecommerce conversion lower than desktop?
Mobile sessions include more discovery-stage traffic, more cross-device handoffs, and more interruptions. Mobile checkout has more tap and form-field friction than desktop, and page load time on mobile networks is more variable. Globally, mobile converts at ~2.3% vs. desktop at ~2.6%; on Shopify, the gap is wider (1.2% mobile vs. 1.9% desktop). Wallet adoption (Apple Pay, Google Pay, Shop Pay) is the most effective single mobile-specific intervention.
What is the average B2B ecommerce conversion rate?
On a purchase-based definition, Atwix’s 2026 platform-level data puts B2B Manufacturing at ~2.2%, Distribution at ~2.4%, Wholesale at ~2.6%, and Industrial Equipment at ~1.8%. On a lead-based definition, Ruler Analytics reports a cross-industry B2B median of 2.9%. The two are not comparable — they measure different things. B2B benchmarks are also unusually sensitive to repeat-account behaviour, which the headline averages tend to underweight.
How do you calculate ecommerce conversion rate?
Ecommerce conversion rate = (orders / sessions) × 100, on a session-based denominator. Variants include unique-visitor-based CVR (orders / unique visitors), checkout completion rate (completed checkouts / initiated checkouts), and email placed-order rate (orders / email recipients). Always specify the denominator when reporting or comparing.
How can ecommerce conversion rate be improved?
In approximate ROI order: page speed (especially mobile), checkout simplification (one-page, transparent costs, wallet payments), product data quality, internal search, trust signals, personalisation, inventory accuracy, mobile UX, B2B quote / reorder friction reduction, and disciplined A/B testing. For complex stores, architectural levers (ERP integration, customer-specific catalogues, contract pricing) are usually larger than UX-level levers once the basics are in place.
What is the difference between ecommerce conversion rate and checkout conversion rate?
Ecommerce conversion rate measures sessions that complete a purchase divided by total sessions. Checkout conversion rate (or checkout completion rate) measures sessions that complete checkout divided by sessions that initiate checkout. The industry average checkout completion rate is roughly 47%, with top performers above 60%. The two metrics isolate different stages of the funnel — ecommerce CVR captures the whole journey; checkout CVR captures the final stage.
14. Methodology
Source selection criteria
Sources cited in this report were selected against four criteria:
- Primary or panel-level data. Live panels (IRP Commerce, Dynamic Yield, Littledata, Statista) and meta-analyses (Baymard Institute) were prioritised over secondary aggregators.
- Methodology disclosure. Sources that disclose sample size, denominator (sessions, visitors, recipients), and panel composition were preferred.
- Recency. Where available, data published in 2025 or 2026 was used. Older landmark studies (e.g. Google / Deloitte 2020) were included where they remain the gold-standard primary study and no newer equivalent exists.
- Independence. First-party platform vendors (Klaviyo, Shopify, Adobe) are useful but biased toward their own population. Where their data is cited, the bias is noted.
Why benchmark ranges instead of single numbers
Single-number benchmarks for ecommerce conversion rate are misleading because the underlying populations differ. IRP Commerce’s 1.70% (live UK SME panel) and Dynamic Yield’s 2.69% (200M-user enterprise panel) are both correct — for their respective populations. Reporting a range with sources is more useful than averaging across incompatible datasets.
Confidence levels
“Confidence” in the tables above reflects three factors: sample size, methodology transparency, and recency. A High rating typically means a disclosed sample of millions of sessions, a clear denominator, and a publication date within 12 months. A Low rating typically means a single agency case, an undisclosed dataset, or a stale publication.
Limitations of comparing datasets
Three structural limitations apply across the report:
- Different denominators. Some sources count all sessions; others filter for high-intent sessions; others count placed-order rate per email recipient. Where this matters, the metric type is noted in the row.
- Sample bias. Opt-in panels (Littledata) skew toward more data-mature merchants. Enterprise panels (Dynamic Yield) skew toward larger merchants. UK-centric panels (IRP Commerce) under-represent US enterprise.
- Definition drift in B2B. “B2B conversion rate” can mean session-to-order, session-to-lead, or session-to-quote-request. Atwix and Ruler Analytics measure different things; both are cited here, but they should not be averaged.
How to benchmark your own store
Use industry-specific data where available. Use device- and channel-specific data inside that. Use platform data only as a sanity check on implementation quality. And weight your own historical data more heavily than any external benchmark: your trend matters more than your absolute position relative to a panel composed of stores unlike yours.
Primary sources cited
- IRP Commerce Ecommerce Market Data — irpcommerce.com/ecommercemarketdata
- Littledata Shopify Benchmark — littledata.io/ecommerce-conversion-rate
- Dynamic Yield eCommerce Benchmarks — marketing.dynamicyield.com/benchmarks
- Statista — Conversion Rate by Country — statista.com/statistics/439576
- Statista — Conversion Rate by Device — statista.com/statistics/1423823
- Baymard Institute — Cart Abandonment — baymard.com/lists/cart-abandonment-rate
- Baymard Institute — Cart & Checkout Usability — baymard.com/research/checkout-usability
- Klaviyo 2026 Email Marketing Benchmarks — klaviyo.com/uk/blog/email-marketing-benchmarks
- Google / Deloitte — Milliseconds Make Millions — deloitte.com/ie/en/services/consulting/research/milliseconds-make-millions
- Portent Site Speed Research — portent.com/blog/analytics/research-site-speed
- Ruler Analytics — Conversion Rate by Industry — ruleranalytics.com/blog/insight/conversion-rate-by-industry
- Atwix B2B eCommerce Benchmarks — atwix.com/magento/b2b-ecommerce-conversion-rate
- Red Stag — Average Ecommerce Conversion Rate — redstagfulfillment.com/average-conversion-rate-for-ecommerce
- Polar Analytics — Ecommerce Benchmarks 2026 — polaranalytics.com/ecommerce-benchmarks
- Landmark Global — Conversion Rates by Factor — landmarkglobal.com/eu/en/news-insights/conversion-rates-factors
- HelloRetail Site Search Statistics — helloretail.com/en/blog/2026-02-24-ecommerce-search-statistics
- Smarter-eCommerce Pricing Study — smarter-ecommerce.com/blog/how-pricing-influences-conversion-rates
- Bidnamic Stock Availability Study — bidnamic.com/resources/how-does-stock-availability-affect-conversion-rate
16. Cite this report
This report is published as a public reference. Citation is welcomed; attribution is required.
Suggested citation format (APA)
Elogic Commerce. (2026). Ecommerce Conversion Rate Benchmarks by Industry [2026].
Retrieved from https://elogic.co/blog/b2b-ecommerce-conversion-rate-benchmarks/
Suggested citation format (editorial)
“According to Elogic Commerce’s 2026 ecommerce conversion rate benchmark report, …”
All datasets in this report are derived from publicly available primary sources. Elogic Commerce’s contribution is structuring, ranging, confidence rating, and interpretation.

Get in Touch
Looking for a partner to grow your business? We are the right company to bring your webstore to success.